When a tenant reports “my order failed 20 minutes ago,” you need to find that exact request across API logs, database queries, background tasks, and external API calls within 30 seconds. Without structured logging and tracing, debugging production issues is grep-and-pray. You search for a timestamp, find 400 log lines from 12 tenants, and spend an hour reconstructing what happened. With structured observability, you filter by tenant_id=powells and trace_id=abc123 and see the entire request lifecycle in one query.
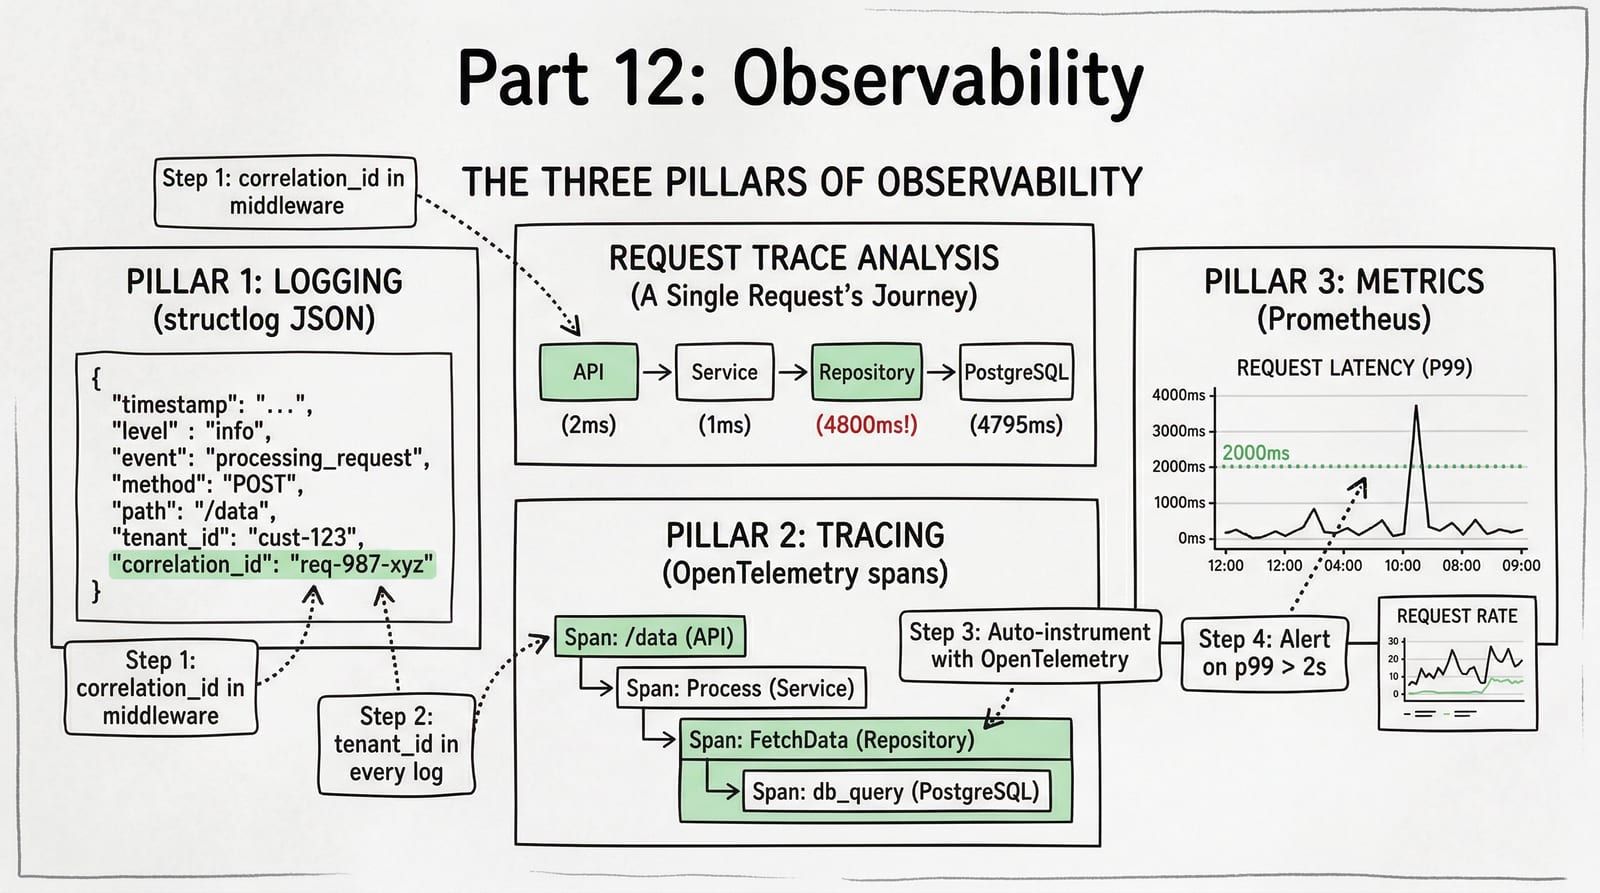
This post adds three observability pillars to the ShelfWise architecture: structured logging with structlog, distributed tracing with OpenTelemetry, and Prometheus metrics with per-tenant labels.
The Three Pillars
| Pillar | Question It Answers | Tool |
|---|---|---|
| Logs | What happened? In what order? With what data? | structlog (JSON) |
| Traces | How long did each step take? Where is the bottleneck? | OpenTelemetry |
| Metrics | How many? How fast? What percentage failed? | Prometheus |
Logs tell you what happened. Traces tell you how long it took. Metrics tell you how often it happens. You need all three, and they must share the same correlation IDs so you can jump from a metric spike to a trace to the exact log line that explains the failure.
Structured Logging with structlog
The standard library logging module produces unstructured text by default. Parsing "2026-04-10 14:23:01 ERROR: Order failed for tenant powells" at scale requires regex. Structured logging produces JSON where every field is queryable.
| Approach | Output | Searchable? |
|---|---|---|
| print() | Order failed for tenant powells | No — grep only, no field filtering |
| logging.error() | ERROR:order_service:Order failed for tenant powells | Barely — level + module, but data baked into message string |
| structlog | {"event": "order_failed", "tenant_id": "powells", "order_id": 42, "level": "error"} | Yes — filter by any field in any log aggregator |
Configuration
import loggingimport structlog

def configure_logging(*, json_output: bool = True, log_level: str = "INFO") -> None:    """Configure structlog for production JSON or development console output."""    shared_processors: list[structlog.types.Processor] = [        structlog.contextvars.merge_contextvars,        structlog.processors.add_log_level,        structlog.processors.TimeStamper(fmt="iso"),        structlog.processors.StackInfoRenderer(),        structlog.processors.format_exc_info,    ]
    if json_output:        renderer = structlog.processors.JSONRenderer()    else:        renderer = structlog.dev.ConsoleRenderer()
    structlog.configure(        processors=[            *shared_processors,            structlog.stdlib.ProcessorFormatter.wrap_for_formatter,        ],        logger_factory=structlog.stdlib.LoggerFactory(),        wrapper_class=structlog.stdlib.BoundLogger,        cache_logger_on_first_use=True,    )
    formatter = structlog.stdlib.ProcessorFormatter(        processors=[            structlog.stdlib.ProcessorFormatter.remove_processors_meta,            renderer,        ],    )
    handler = logging.StreamHandler()    handler.setFormatter(formatter)
    root_logger = logging.getLogger()    root_logger.handlers.clear()    root_logger.addHandler(handler)    root_logger.setLevel(log_level)
The critical line is structlog.contextvars.merge_contextvars. This processor pulls any values bound via structlog.contextvars.bind_contextvars() and merges them into every log entry automatically. Bind the tenant ID once in middleware, and every log line in that request includes it without passing a logger around.
Middleware: Bind Request Context
import uuidimport timefrom collections.abc import Awaitable, Callable
import structlogfrom starlette.middleware.base import BaseHTTPMiddlewarefrom starlette.requests import Requestfrom starlette.responses import Response
from src.core.tenant import TenantContext
logger = structlog.get_logger()

class ObservabilityMiddleware(BaseHTTPMiddleware):    """Bind correlation IDs and tenant context to every log line."""
    async def dispatch(        self,        request: Request,        call_next: Callable[[Request], Awaitable[Response]],    ) -> Response:        request_id = request.headers.get("X-Request-ID", str(uuid.uuid4()))        tenant_id = TenantContext.get()
        structlog.contextvars.clear_contextvars()        structlog.contextvars.bind_contextvars(            request_id=request_id,            tenant_id=tenant_id,            method=request.method,            path=request.url.path,        )
        start = time.perf_counter()        logger.info("request_started")
        try:            response = await call_next(request)        except Exception:            logger.exception("request_failed")            raise
        duration_ms = round((time.perf_counter() - start) * 1000, 2)        logger.info(            "request_completed",            status_code=response.status_code,            duration_ms=duration_ms,        )        response.headers["X-Request-ID"] = request_id        return response
Every log line emitted during this request now includes request_id, tenant_id, method, and path without any explicit passing. The service layer, repository, and even third-party libraries that use stdlib logging get these fields automatically.
Distributed Tracing with OpenTelemetry
Logs tell you what happened. Traces tell you where the time went. OpenTelemetry provides auto-instrumentation for FastAPI, SQLAlchemy, httpx, and Redis — meaning you get spans for every HTTP handler, every SQL query, every outbound HTTP call, and every Redis command without writing instrumentation code.
Setup
from opentelemetry import tracefrom opentelemetry.exporter.otlp.proto.grpc.trace_exporter import OTLPSpanExporterfrom opentelemetry.instrumentation.fastapi import FastAPIInstrumentorfrom opentelemetry.instrumentation.sqlalchemy import SQLAlchemyInstrumentorfrom opentelemetry.instrumentation.httpx import HTTPXClientInstrumentorfrom opentelemetry.instrumentation.redis import RedisInstrumentorfrom opentelemetry.sdk.resources import Resourcefrom opentelemetry.sdk.trace import TracerProviderfrom opentelemetry.sdk.trace.export import BatchSpanProcessor

def configure_tracing(*, service_name: str, otlp_endpoint: str) -> None:    """Initialize OpenTelemetry with auto-instrumentation."""    resource = Resource.create({"service.name": service_name})    provider = TracerProvider(resource=resource)
    exporter = OTLPSpanExporter(endpoint=otlp_endpoint)    provider.add_span_processor(BatchSpanProcessor(exporter))
    trace.set_tracer_provider(provider)
    # Auto-instrument everything — zero manual spans needed for basic coverage    FastAPIInstrumentor.instrument()    SQLAlchemyInstrumentor().instrument()    HTTPXClientInstrumentor().instrument()    RedisInstrumentor().instrument()
Auto-instrumentation gives you a span for every FastAPI route handler, every SQLAlchemy query, every outbound httpx request, and every Redis command. For most requests, this is sufficient to identify the bottleneck without writing a single custom span.
Custom Spans for Business Operations
Auto-instrumentation covers infrastructure. Business operations need explicit spans — you want to see “order processing” and “payment capture” as named spans in your trace, not just a series of SQL queries:
import structlogfrom opentelemetry import trace
from src.core.protocols import OrderRepositoryProtocol, PaymentGatewayProtocolfrom src.schemas.order import OrderCreate, OrderResponse
logger = structlog.get_logger()tracer = trace.get_tracer(__name__)

class OrderService:    def __init__(        self,        *,        order_repo: OrderRepositoryProtocol,        payment_gateway: PaymentGatewayProtocol,    ) -> None:        self._order_repo = order_repo        self._payment = payment_gateway
    async def create_order(self, data: OrderCreate) -> OrderResponse:        with tracer.start_as_current_span("order.create") as span:            span.set_attribute("tenant_id", data.tenant_id)            span.set_attribute("item_count", len(data.items))
            with tracer.start_as_current_span("order.validate_inventory"):                await self._validate_inventory(data)
            with tracer.start_as_current_span("order.persist"):                order = await self._order_repo.create(data)                span.set_attribute("order_id", str(order.id))
            with tracer.start_as_current_span("order.capture_payment"):                await self._payment.capture(                    amount=order.total,                    tenant_id=data.tenant_id,                )
            logger.info(                "order_created",                order_id=str(order.id),                total=str(order.total),                item_count=len(data.items),            )            return order
The trace for this request now shows:
%3b%7d%23mermaid-0 .section2%7bfill:hsl(0%2c 0%25%2c 73.9215686275%25)%3b%7d%23mermaid-0 .section1%2c%23mermaid-0 .section3%7bfill:white%3bopacity:0.2%3b%7d%23mermaid-0 .sectionTitle0%7bfill:%23333%3b%7d%23mermaid-0 .sectionTitle1%7bfill:%23333%3b%7d%23mermaid-0 .sectionTitle2%7bfill:%23333%3b%7d%23mermaid-0 .sectionTitle3%7bfill:%23333%3b%7d%23mermaid-0 .sectionTitle%7btext-anchor:start%3bfont-family:arial%2csans-serif%3b%7d%23mermaid-0 .grid .tick%7bstroke:hsl(0%2c 0%25%2c 90%25)%3bopacity:0.8%3bshape-rendering:crispEdges%3b%7d%23mermaid-0 .grid .tick text%7bfont-family:arial%2csans-serif%3bfill:black%3b%7d%23mermaid-0 .grid path%7bstroke-width:0%3b%7d%23mermaid-0 .today%7bfill:none%3bstroke:%23d42%3bstroke-width:2px%3b%7d%23mermaid-0 .task%7bstroke-width:2%3b%7d%23mermaid-0 .taskText%7btext-anchor:middle%3bfont-family:arial%2csans-serif%3b%7d%23mermaid-0 .taskTextOutsideRight%7bfill:%23333%3btext-anchor:start%3bfont-family:arial%2csans-serif%3b%7d%23mermaid-0 .taskTextOutsideLeft%7bfill:%23333%3btext-anchor:end%3b%7d%23mermaid-0 .task.clickable%7bcursor:pointer%3b%7d%23mermaid-0 .taskText.clickable%7bcursor:pointer%3bfill:%23003163!important%3bfont-weight:bold%3b%7d%23mermaid-0 .taskTextOutsideLeft.clickable%7bcursor:pointer%3bfill:%23003163!important%3bfont-weight:bold%3b%7d%23mermaid-0 .taskTextOutsideRight.clickable%7bcursor:pointer%3bfill:%23003163!important%3bfont-weight:bold%3b%7d%23mermaid-0 .taskText0%2c%23mermaid-0 .taskText1%2c%23mermaid-0 .taskText2%2c%23mermaid-0 .taskText3%7bfill:white%3b%7d%23mermaid-0 .task0%2c%23mermaid-0 .task1%2c%23mermaid-0 .task2%2c%23mermaid-0 .task3%7bfill:%23707070%3bstroke:hsl(0%2c 0%25%2c 33.9215686275%25)%3b%7d%23mermaid-0 .taskTextOutside0%2c%23mermaid-0 .taskTextOutside2%7bfill:%23333%3b%7d%23mermaid-0 .taskTextOutside1%2c%23mermaid-0 .taskTextOutside3%7bfill:%23333%3b%7d%23mermaid-0 .active0%2c%23mermaid-0 .active1%2c%23mermaid-0 .active2%2c%23mermaid-0 .active3%7bfill:%23eee%3bstroke:hsl(0%2c 0%25%2c 33.9215686275%25)%3b%7d%23mermaid-0 .activeText0%2c%23mermaid-0 .activeText1%2c%23mermaid-0 .activeText2%2c%23mermaid-0 .activeText3%7bfill:%23333!important%3b%7d%23mermaid-0 .done0%2c%23mermaid-0 .done1%2c%23mermaid-0 .done2%2c%23mermaid-0 .done3%7bstroke:%23666%3bfill:%23bbb%3bstroke-width:2%3b%7d%23mermaid-0 .doneText0%2c%23mermaid-0 .doneText1%2c%23mermaid-0 .doneText2%2c%23mermaid-0 .doneText3%7bfill:%23333!important%3b%7d%23mermaid-0 .doneText0.taskTextOutsideLeft%2c%23mermaid-0 .doneText0.taskTextOutsideRight%2c%23mermaid-0 .doneText1.taskTextOutsideLeft%2c%23mermaid-0 .doneText1.taskTextOutsideRight%2c%23mermaid-0 .doneText2.taskTextOutsideLeft%2c%23mermaid-0 .doneText2.taskTextOutsideRight%2c%23mermaid-0 .doneText3.taskTextOutsideLeft%2c%23mermaid-0 .doneText3.taskTextOutsideRight%7bfill:%23333!important%3b%7d%23mermaid-0 .crit0%2c%23mermaid-0 .crit1%2c%23mermaid-0 .crit2%2c%23mermaid-0 .crit3%7bstroke:hsl(10.9090909091%2c 73.3333333333%25%2c 40%25)%3bfill:%23d42%3bstroke-width:2%3b%7d%23mermaid-0 .activeCrit0%2c%23mermaid-0 .activeCrit1%2c%23mermaid-0 .activeCrit2%2c%23mermaid-0 .activeCrit3%7bstroke:hsl(10.9090909091%2c 73.3333333333%25%2c 40%25)%3bfill:%23eee%3bstroke-width:2%3b%7d%23mermaid-0 .doneCrit0%2c%23mermaid-0 .doneCrit1%2c%23mermaid-0 .doneCrit2%2c%23mermaid-0 .doneCrit3%7bstroke:hsl(10.9090909091%2c 73.3333333333%25%2c 40%25)%3bfill:%23bbb%3bstroke-width:2%3bcursor:pointer%3bshape-rendering:crispEdges%3b%7d%23mermaid-0 .milestone%7btransform:rotate(45deg) scale(0.8%2c0.8)%3b%7d%23mermaid-0 .milestoneText%7bfont-style:italic%3b%7d%23mermaid-0 .doneCritText0%2c%23mermaid-0 .doneCritText1%2c%23mermaid-0 .doneCritText2%2c%23mermaid-0 .doneCritText3%7bfill:%23333!important%3b%7d%23mermaid-0 .doneCritText0.taskTextOutsideLeft%2c%23mermaid-0 .doneCritText0.taskTextOutsideRight%2c%23mermaid-0 .doneCritText1.taskTextOutsideLeft%2c%23mermaid-0 .doneCritText1.taskTextOutsideRight%2c%23mermaid-0 .doneCritText2.taskTextOutsideLeft%2c%23mermaid-0 .doneCritText2.taskTextOutsideRight%2c%23mermaid-0 .doneCritText3.taskTextOutsideLeft%2c%23mermaid-0 .doneCritText3.taskTextOutsideRight%7bfill:%23333!important%3b%7d%23mermaid-0 .vert%7bstroke:%23d42%3b%7d%23mermaid-0 .vertText%7bfont-size:15px%3btext-anchor:middle%3bfill:%23d42!important%3b%7d%23mermaid-0 .activeCritText0%2c%23mermaid-0 .activeCritText1%2c%23mermaid-0 .activeCritText2%2c%23mermaid-0 .activeCritText3%7bfill:%23333!important%3b%7d%23mermaid-0 .titleText%7btext-anchor:middle%3bfont-size:18px%3bfill:%23333%3bfont-family:arial%2csans-serif%3b%7d%23mermaid-0 .node .neo-node%7bstroke:%23999%3b%7d%23mermaid-0 %5bdata-look='neo'%5d.node rect%2c%23mermaid-0 %5bdata-look='neo'%5d.cluster rect%2c%23mermaid-0 %5bdata-look='neo'%5d.node polygon%7bstroke:url(%23mermaid-0-gradient)%3bfilter:drop-shadow( 1px 2px 2px rgba(185%2c185%2c185%2c1))%3b%7d%23mermaid-0 %5bdata-look='neo'%5d.node path%7bstroke:url(%23mermaid-0-gradient)%3bstroke-width:1px%3b%7d%23mermaid-0 %5bdata-look='neo'%5d.node .outer-path%7bfilter:drop-shadow( 1px 2px 2px rgba(185%2c185%2c185%2c1))%3b%7d%23mermaid-0 %5bdata-look='neo'%5d.node .neo-line path%7bstroke:%23999%3bfilter:none%3b%7d%23mermaid-0 %5bdata-look='neo'%5d.node circle%7bstroke:url(%23mermaid-0-gradient)%3bfilter:drop-shadow( 1px 2px 2px rgba(185%2c185%2c185%2c1))%3b%7d%23mermaid-0 %5bdata-look='neo'%5d.node circle .state-start%7bfill:black%3b%7d%23mermaid-0 %5bdata-look='neo'%5d.icon-shape .icon%7bfill:url(%23mermaid-0-gradient)%3bfilter:drop-shadow( 1px 2px 2px rgba(185%2c185%2c185%2c1))%3b%7d%23mermaid-0 %5bdata-look='neo'%5d.icon-shape .icon-neo path%7bstroke:url(%23mermaid-0-gradient)%3bfilter:drop-shadow( 1px 2px 2px rgba(185%2c185%2c185%2c1))%3b%7d%23mermaid-0 :root%7b--mermaid-font-family:arial%2csans-serif%3b%7d%3c/style%3e%3cg/%3e%3cg class='grid' transform='translate(75%2c 242)' fill='none' font-size='10' font-family='sans-serif' text-anchor='middle'%3e%3cpath class='domain' stroke='currentColor' d='M0.5%2c-207V0.5H1114.5V-207'/%3e%3cg class='tick' opacity='1' transform='translate(0.5%2c0)'%3e%3cline stroke='currentColor' y2='-207'/%3e%3ctext fill='black' y='3' dy='1em' stroke='none' font-size='10' style='text-anchor: middle%3b'%3e0%3c/text%3e%3c/g%3e%3cg class='tick' opacity='1' transform='translate(193.5%2c0)'%3e%3cline stroke='currentColor' y2='-207'/%3e%3ctext fill='black' y='3' dy='1em' stroke='none' font-size='10' style='text-anchor: middle%3b'%3e900%3c/text%3e%3c/g%3e%3cg class='tick' opacity='1' transform='translate(386.5%2c0)'%3e%3cline stroke='currentColor' y2='-207'/%3e%3ctext fill='black' y='3' dy='1em' stroke='none' font-size='10' style='text-anchor: middle%3b'%3e1800%3c/text%3e%3c/g%3e%3cg class='tick' opacity='1' transform='translate(578.5%2c0)'%3e%3cline stroke='currentColor' y2='-207'/%3e%3ctext fill='black' y='3' dy='1em' stroke='none' font-size='10' style='text-anchor: middle%3b'%3e2700%3c/text%3e%3c/g%3e%3cg class='tick' opacity='1' transform='translate(771.5%2c0)'%3e%3cline stroke='currentColor' y2='-207'/%3e%3ctext fill='black' y='3' dy='1em' stroke='none' font-size='10' style='text-anchor: middle%3b'%3e3600%3c/text%3e%3c/g%3e%3cg class='tick' opacity='1' transform='translate(964.5%2c0)'%3e%3cline stroke='currentColor' y2='-207'/%3e%3ctext fill='black' y='3' dy='1em' stroke='none' font-size='10' style='text-anchor: middle%3b'%3e4500%3c/text%3e%3c/g%3e%3c/g%3e%3cg%3e%3crect x='0' y='48' width='1226.5' height='24' class='section section0'/%3e%3crect x='0' y='72' width='1226.5' height='24' class='section section1'/%3e%3crect x='0' y='96' width='1226.5' height='24' class='section section1'/%3e%3crect x='0' y='168' width='1226.5' height='24' class='section section2'/%3e%3crect x='0' y='120' width='1226.5' height='24' class='section section1'/%3e%3crect x='0' y='192' width='1226.5' height='24' class='section section2'/%3e%3crect x='0' y='144' width='1226.5' height='24' class='section section1'/%3e%3crect x='0' y='216' width='1226.5' height='24' class='section section3'/%3e%3c/g%3e%3cg%3e%3crect id='mermaid-0-task1' rx='3' ry='3' x='75' y='50' width='1114' height='20' transform-origin='632px 60px' class='task task0'/%3e%3crect id='mermaid-0-task2' rx='3' ry='3' x='75' y='74' width='1093' height='20' transform-origin='621.5px 84px' class='task task1'/%3e%3crect id='mermaid-0-task3' rx='3' ry='3' x='75' y='98' width='86' height='20' transform-origin='118px 108px' class='task task1'/%3e%3crect id='mermaid-0-task6' rx='3' ry='3' x='75' y='170' width='32' height='20' transform-origin='91px 180px' class='task task2'/%3e%3crect id='mermaid-0-task4' rx='3' ry='3' x='75' y='122' width='193' height='20' transform-origin='171.5px 132px' class='task task1'/%3e%3crect id='mermaid-0-task7' rx='3' ry='3' x='75' y='194' width='64' height='20' transform-origin='107px 204px' class='task task2'/%3e%3crect id='mermaid-0-task5' rx='3' ry='3' x='75' y='146' width='1028' height='20' transform-origin='589px 156px' class='task task1'/%3e%3crect id='mermaid-0-task8' rx='3' ry='3' x='75' y='218' width='793' height='20' transform-origin='471.5px 228px' class='task task3'/%3e%3ctext id='mermaid-0-task1-text' font-size='11' x='632' y='63.5' class='taskText taskText0 width-99.453125'%3ePOST /api/v1/orders %3c/text%3e%3ctext id='mermaid-0-task2-text' font-size='11' x='621.5' y='87.5' class='taskText taskText1 width-58.703125'%3eorder.create %3c/text%3e%3ctext id='mermaid-0-task3-text' font-size='11' x='166' y='111.5' class='taskTextOutsideRight taskTextOutside1 width-116.796875'%3eorder.validate_inventory %3c/text%3e%3ctext id='mermaid-0-task6-text' font-size='11' x='112' y='183.5' class='taskTextOutsideRight taskTextOutside2 width-90.296875'%3eSELECT inventory %3c/text%3e%3ctext id='mermaid-0-task4-text' font-size='11' x='171.5' y='135.5' class='taskText taskText1 width-60.53125'%3eorder.persist %3c/text%3e%3ctext id='mermaid-0-task7-text' font-size='11' x='144' y='207.5' class='taskTextOutsideRight taskTextOutside2 width-68.8251953125'%3eINSERT order %3c/text%3e%3ctext id='mermaid-0-task5-text' font-size='11' x='589' y='159.5' class='taskText taskText1 width-113.140625'%3eorder.capture_payment %3c/text%3e%3ctext id='mermaid-0-task8-text' font-size='11' x='471.5' y='231.5' class='taskText taskText3 width-142.65625'%3ePOST payment-gateway.com %3c/text%3e%3c/g%3e%3cg%3e%3ctext dy='0em' x='10' y='62' font-size='11' class='sectionTitle sectionTitle0'%3e%3ctspan alignment-baseline='central' x='10'%3eFastAPI%3c/tspan%3e%3c/text%3e%3ctext dy='0em' x='10' y='122' font-size='11' class='sectionTitle sectionTitle1'%3e%3ctspan alignment-baseline='central' x='10'%3eOrderService%3c/tspan%3e%3c/text%3e%3ctext dy='0em' x='10' y='194' font-size='11' class='sectionTitle sectionTitle2'%3e%3ctspan alignment-baseline='central' x='10'%3eSQLAlchemy%3c/tspan%3e%3c/text%3e%3ctext dy='0em' x='10' y='230' font-size='11' class='sectionTitle sectionTitle3'%3e%3ctspan alignment-baseline='central' x='10'%3ehttpx%3c/tspan%3e%3c/text%3e%3c/g%3e%3cg class='today'%3e%3cline x1='380485882' x2='380485882' y1='25' y2='267' class='today'/%3e%3c/g%3e%3ctext x='632' y='25' class='titleText'%3eRequest Trace: POST /api/v1/orders%3c/text%3e%3c/svg%3e)
The bottleneck is immediately visible: the payment gateway takes 3700ms of a 5200ms request. No guessing, no log parsing.
The ShelfWise Debugging Scenario
Powell’s Books reports that their catalog search is taking 5 seconds. Here is the trace:
%3b%7d%23mermaid-1 .cluster rect%7bfill:hsl(0%2c 0%25%2c 98.9215686275%25)%3bstroke:%23707070%3bstroke-width:1px%3b%7d%23mermaid-1 .cluster text%7bfill:%23333%3b%7d%23mermaid-1 .cluster span%7bcolor:%23333%3b%7d%23mermaid-1 div.mermaidTooltip%7bposition:absolute%3btext-align:center%3bmax-width:200px%3bpadding:2px%3bfont-family:arial%2csans-serif%3bfont-size:12px%3bbackground:hsl(-160%2c 0%25%2c 93.3333333333%25)%3bborder:1px solid %23707070%3bborder-radius:2px%3bpointer-events:none%3bz-index:100%3b%7d%23mermaid-1 .flowchartTitleText%7btext-anchor:middle%3bfont-size:18px%3bfill:black%3b%7d%23mermaid-1 rect.text%7bfill:none%3bstroke-width:0%3b%7d%23mermaid-1 .icon-shape%2c%23mermaid-1 .image-shape%7bbackground-color:white%3btext-align:center%3b%7d%23mermaid-1 .icon-shape p%2c%23mermaid-1 .image-shape p%7bbackground-color:white%3bpadding:2px%3b%7d%23mermaid-1 .icon-shape .label rect%2c%23mermaid-1 .image-shape .label rect%7bopacity:0.5%3bbackground-color:white%3bfill:white%3b%7d%23mermaid-1 .label-icon%7bdisplay:inline-block%3bheight:1em%3boverflow:visible%3bvertical-align:-0.125em%3b%7d%23mermaid-1 .node .label-icon path%7bfill:currentColor%3bstroke:revert%3bstroke-width:revert%3b%7d%23mermaid-1 .node .neo-node%7bstroke:%23999%3b%7d%23mermaid-1 %5bdata-look='neo'%5d.node rect%2c%23mermaid-1 %5bdata-look='neo'%5d.cluster rect%2c%23mermaid-1 %5bdata-look='neo'%5d.node polygon%7bstroke:url(%23mermaid-1-gradient)%3bfilter:drop-shadow( 1px 2px 2px rgba(185%2c185%2c185%2c1))%3b%7d%23mermaid-1 %5bdata-look='neo'%5d.node path%7bstroke:url(%23mermaid-1-gradient)%3bstroke-width:1px%3b%7d%23mermaid-1 %5bdata-look='neo'%5d.node .outer-path%7bfilter:drop-shadow( 1px 2px 2px rgba(185%2c185%2c185%2c1))%3b%7d%23mermaid-1 %5bdata-look='neo'%5d.node .neo-line path%7bstroke:%23999%3bfilter:none%3b%7d%23mermaid-1 %5bdata-look='neo'%5d.node circle%7bstroke:url(%23mermaid-1-gradient)%3bfilter:drop-shadow( 1px 2px 2px rgba(185%2c185%2c185%2c1))%3b%7d%23mermaid-1 %5bdata-look='neo'%5d.node circle .state-start%7bfill:black%3b%7d%23mermaid-1 %5bdata-look='neo'%5d.icon-shape .icon%7bfill:url(%23mermaid-1-gradient)%3bfilter:drop-shadow( 1px 2px 2px rgba(185%2c185%2c185%2c1))%3b%7d%23mermaid-1 %5bdata-look='neo'%5d.icon-shape .icon-neo path%7bstroke:url(%23mermaid-1-gradient)%3bfilter:drop-shadow( 1px 2px 2px rgba(185%2c185%2c185%2c1))%3b%7d%23mermaid-1 :root%7b--mermaid-font-family:arial%2csans-serif%3b%7d%3c/style%3e%3cg%3e%3cmarker id='mermaid-1_flowchart-v2-pointEnd' class='marker flowchart-v2' viewBox='0 0 10 10' refX='5' refY='5' markerUnits='userSpaceOnUse' markerWidth='8' markerHeight='8' orient='auto'%3e%3cpath d='M 0 0 L 10 5 L 0 10 z' class='arrowMarkerPath' style='stroke-width: 1%3b stroke-dasharray: 1%2c 0%3b'/%3e%3c/marker%3e%3cmarker id='mermaid-1_flowchart-v2-pointStart' class='marker flowchart-v2' viewBox='0 0 10 10' refX='4.5' refY='5' markerUnits='userSpaceOnUse' markerWidth='8' markerHeight='8' orient='auto'%3e%3cpath d='M 0 5 L 10 10 L 10 0 z' class='arrowMarkerPath' style='stroke-width: 1%3b stroke-dasharray: 1%2c 0%3b'/%3e%3c/marker%3e%3cmarker id='mermaid-1_flowchart-v2-pointEnd-margin' class='marker flowchart-v2' viewBox='0 0 11.5 14' refX='11.5' refY='7' markerUnits='userSpaceOnUse' markerWidth='10.5' markerHeight='14' orient='auto'%3e%3cpath d='M 0 0 L 11.5 7 L 0 14 z' class='arrowMarkerPath' style='stroke-width: 0%3b stroke-dasharray: 1%2c 0%3b'/%3e%3c/marker%3e%3cmarker id='mermaid-1_flowchart-v2-pointStart-margin' class='marker flowchart-v2' viewBox='0 0 11.5 14' refX='1' refY='7' markerUnits='userSpaceOnUse' markerWidth='11.5' markerHeight='14' orient='auto'%3e%3cpolygon points='0%2c7 11.5%2c14 11.5%2c0' class='arrowMarkerPath' style='stroke-width: 0%3b stroke-dasharray: 1%2c 0%3b'/%3e%3c/marker%3e%3cmarker id='mermaid-1_flowchart-v2-circleEnd' class='marker flowchart-v2' viewBox='0 0 10 10' refX='11' refY='5' markerUnits='userSpaceOnUse' markerWidth='11' markerHeight='11' orient='auto'%3e%3ccircle cx='5' cy='5' r='5' class='arrowMarkerPath' style='stroke-width: 1%3b stroke-dasharray: 1%2c 0%3b'/%3e%3c/marker%3e%3cmarker id='mermaid-1_flowchart-v2-circleStart' class='marker flowchart-v2' viewBox='0 0 10 10' refX='-1' refY='5' markerUnits='userSpaceOnUse' markerWidth='11' markerHeight='11' orient='auto'%3e%3ccircle cx='5' cy='5' r='5' class='arrowMarkerPath' style='stroke-width: 1%3b stroke-dasharray: 1%2c 0%3b'/%3e%3c/marker%3e%3cmarker id='mermaid-1_flowchart-v2-circleEnd-margin' class='marker flowchart-v2' viewBox='0 0 10 10' refY='5' refX='12.25' markerUnits='userSpaceOnUse' markerWidth='14' markerHeight='14' orient='auto'%3e%3ccircle cx='5' cy='5' r='5' class='arrowMarkerPath' style='stroke-width: 0%3b stroke-dasharray: 1%2c 0%3b'/%3e%3c/marker%3e%3cmarker id='mermaid-1_flowchart-v2-circleStart-margin' class='marker flowchart-v2' viewBox='0 0 10 10' refX='-2' refY='5' markerUnits='userSpaceOnUse' markerWidth='14' markerHeight='14' orient='auto'%3e%3ccircle cx='5' cy='5' r='5' class='arrowMarkerPath' style='stroke-width: 0%3b stroke-dasharray: 1%2c 0%3b'/%3e%3c/marker%3e%3cmarker id='mermaid-1_flowchart-v2-crossEnd' class='marker cross flowchart-v2' viewBox='0 0 11 11' refX='12' refY='5.2' markerUnits='userSpaceOnUse' markerWidth='11' markerHeight='11' orient='auto'%3e%3cpath d='M 1%2c1 l 9%2c9 M 10%2c1 l -9%2c9' class='arrowMarkerPath' style='stroke-width: 2%3b stroke-dasharray: 1%2c 0%3b'/%3e%3c/marker%3e%3cmarker id='mermaid-1_flowchart-v2-crossStart' class='marker cross flowchart-v2' viewBox='0 0 11 11' refX='-1' refY='5.2' markerUnits='userSpaceOnUse' markerWidth='11' markerHeight='11' orient='auto'%3e%3cpath d='M 1%2c1 l 9%2c9 M 10%2c1 l -9%2c9' class='arrowMarkerPath' style='stroke-width: 2%3b stroke-dasharray: 1%2c 0%3b'/%3e%3c/marker%3e%3cmarker id='mermaid-1_flowchart-v2-crossEnd-margin' class='marker cross flowchart-v2' viewBox='0 0 15 15' refX='17.7' refY='7.5' markerUnits='userSpaceOnUse' markerWidth='12' markerHeight='12' orient='auto'%3e%3cpath d='M 1%2c1 L 14%2c14 M 1%2c14 L 14%2c1' class='arrowMarkerPath' style='stroke-width: 2.5%3b'/%3e%3c/marker%3e%3cmarker id='mermaid-1_flowchart-v2-crossStart-margin' class='marker cross flowchart-v2' viewBox='0 0 15 15' refX='-3.5' refY='7.5' markerUnits='userSpaceOnUse' markerWidth='12' markerHeight='12' orient='auto'%3e%3cpath d='M 1%2c1 L 14%2c14 M 1%2c14 L 14%2c1' class='arrowMarkerPath' style='stroke-width: 2.5%3b stroke-dasharray: 1%2c 0%3b'/%3e%3c/marker%3e%3cg class='root'%3e%3cg class='clusters'/%3e%3cg class='edgePaths'%3e%3cpath d='M208.234%2c59L212.401%2c59C216.568%2c59%2c224.901%2c59%2c232.568%2c59C240.234%2c59%2c247.234%2c59%2c250.734%2c59L254.234%2c59' id='mermaid-1-L_A_B_0' class='edge-thickness-normal edge-pattern-solid edge-thickness-normal edge-pattern-solid flowchart-link' style='%3b' data-edge='true' data-et='edge' data-id='L_A_B_0' data-points='W3sieCI6MjA4LjIzNDM3NSwieSI6NTl9LHsieCI6MjMzLjIzNDM3NSwieSI6NTl9LHsieCI6MjU4LjIzNDM3NSwieSI6NTl9XQ==' data-look='classic' marker-end='url(%23mermaid-1_flowchart-v2-pointEnd)'/%3e%3cpath d='M426.734%2c59L430.901%2c59C435.068%2c59%2c443.401%2c59%2c451.068%2c59C458.734%2c59%2c465.734%2c59%2c469.234%2c59L472.734%2c59' id='mermaid-1-L_B_C_0' class='edge-thickness-normal edge-pattern-solid edge-thickness-normal edge-pattern-solid flowchart-link' style='%3b' data-edge='true' data-et='edge' data-id='L_B_C_0' data-points='W3sieCI6NDI2LjczNDM3NSwieSI6NTl9LHsieCI6NDUxLjczNDM3NSwieSI6NTl9LHsieCI6NDc2LjczNDM3NSwieSI6NTl9XQ==' data-look='classic' marker-end='url(%23mermaid-1_flowchart-v2-pointEnd)'/%3e%3cpath d='M668.359%2c59L672.526%2c59C676.693%2c59%2c685.026%2c59%2c692.693%2c59C700.359%2c59%2c707.359%2c59%2c710.859%2c59L714.359%2c59' id='mermaid-1-L_C_D_0' class='edge-thickness-normal edge-pattern-solid edge-thickness-normal edge-pattern-solid flowchart-link' style='%3b' data-edge='true' data-et='edge' data-id='L_C_D_0' data-points='W3sieCI6NjY4LjM1OTM3NSwieSI6NTl9LHsieCI6NjkzLjM1OTM3NSwieSI6NTl9LHsieCI6NzE4LjM1OTM3NSwieSI6NTl9XQ==' data-look='classic' marker-end='url(%23mermaid-1_flowchart-v2-pointEnd)'/%3e%3c/g%3e%3cg class='edgeLabels'%3e%3cg class='edgeLabel'%3e%3cg class='label' data-id='L_A_B_0' transform='translate(0%2c 0)'%3e%3cforeignObject width='0' height='0'%3e%3cdiv xmlns='http://www.w3.org/1999/xhtml' class='labelBkg' style='display: table-cell%3b white-space: nowrap%3b line-height: 1.5%3b max-width: 200px%3b text-align: center%3b'%3e%3cspan class='edgeLabel'%3e%3c/span%3e%3c/div%3e%3c/foreignObject%3e%3c/g%3e%3c/g%3e%3cg class='edgeLabel'%3e%3cg class='label' data-id='L_B_C_0' transform='translate(0%2c 0)'%3e%3cforeignObject width='0' height='0'%3e%3cdiv xmlns='http://www.w3.org/1999/xhtml' class='labelBkg' style='display: table-cell%3b white-space: nowrap%3b line-height: 1.5%3b max-width: 200px%3b text-align: center%3b'%3e%3cspan class='edgeLabel'%3e%3c/span%3e%3c/div%3e%3c/foreignObject%3e%3c/g%3e%3c/g%3e%3cg class='edgeLabel'%3e%3cg class='label' data-id='L_C_D_0' transform='translate(0%2c 0)'%3e%3cforeignObject width='0' height='0'%3e%3cdiv xmlns='http://www.w3.org/1999/xhtml' class='labelBkg' style='display: table-cell%3b white-space: nowrap%3b line-height: 1.5%3b max-width: 200px%3b text-align: center%3b'%3e%3cspan class='edgeLabel'%3e%3c/span%3e%3c/div%3e%3c/foreignObject%3e%3c/g%3e%3c/g%3e%3c/g%3e%3cg class='nodes'%3e%3cg class='node default' id='mermaid-1-flowchart-A-0' data-look='classic' transform='translate(108.1171875%2c 59)'%3e%3crect class='basic label-container' style='fill:%23e8f5e9 !important%3bstroke:%232e7d32 !important' x='-100.1171875' y='-51' width='200.234375' height='102'/%3e%3cg class='label' style='' transform='translate(-70.1171875%2c -36)'%3e%3crect/%3e%3cforeignObject width='140.234375' height='72'%3e%3cdiv xmlns='http://www.w3.org/1999/xhtml' style='display: table-cell%3b white-space: nowrap%3b line-height: 1.5%3b max-width: 200px%3b text-align: center%3b'%3e%3cspan class='nodeLabel'%3e%3cp%3eAPI Handler%3cbr /%3eGET /api/v1/catalog%3cbr /%3e2ms%3c/p%3e%3c/span%3e%3c/div%3e%3c/foreignObject%3e%3c/g%3e%3c/g%3e%3cg class='node default' id='mermaid-1-flowchart-B-1' data-look='classic' transform='translate(342.484375%2c 59)'%3e%3crect class='basic label-container' style='fill:%23e8f5e9 !important%3bstroke:%232e7d32 !important' x='-84.25' y='-51' width='168.5' height='102'/%3e%3cg class='label' style='' transform='translate(-54.25%2c -36)'%3e%3crect/%3e%3cforeignObject width='108.5' height='72'%3e%3cdiv xmlns='http://www.w3.org/1999/xhtml' style='display: table-cell%3b white-space: nowrap%3b line-height: 1.5%3b max-width: 200px%3b text-align: center%3b'%3e%3cspan class='nodeLabel'%3e%3cp%3eCatalogService%3cbr /%3e.search()%3cbr /%3e1ms%3c/p%3e%3c/span%3e%3c/div%3e%3c/foreignObject%3e%3c/g%3e%3c/g%3e%3cg class='node default' id='mermaid-1-flowchart-C-3' data-look='classic' transform='translate(572.546875%2c 59)'%3e%3crect class='basic label-container' style='fill:%23ffcdd2 !important%3bstroke:%23c62828 !important' x='-95.8125' y='-51' width='191.625' height='102'/%3e%3cg class='label' style='' transform='translate(-65.8125%2c -36)'%3e%3crect/%3e%3cforeignObject width='131.625' height='72'%3e%3cdiv xmlns='http://www.w3.org/1999/xhtml' style='display: table-cell%3b white-space: nowrap%3b line-height: 1.5%3b max-width: 200px%3b text-align: center%3b'%3e%3cspan class='nodeLabel'%3e%3cp%3eCatalogRepository%3cbr /%3e.search()%3cbr /%3e4800ms%3c/p%3e%3c/span%3e%3c/div%3e%3c/foreignObject%3e%3c/g%3e%3c/g%3e%3cg class='node default' id='mermaid-1-flowchart-D-5' data-look='classic' transform='translate(829.1171875%2c 59)'%3e%3crect class='basic label-container' style='fill:%23ffcdd2 !important%3bstroke:%23c62828 !important' x='-110.7578125' y='-51' width='221.515625' height='102'/%3e%3cg class='label' style='' transform='translate(-80.7578125%2c -36)'%3e%3crect/%3e%3cforeignObject width='161.515625' height='72'%3e%3cdiv xmlns='http://www.w3.org/1999/xhtml' style='display: table-cell%3b white-space: nowrap%3b line-height: 1.5%3b max-width: 200px%3b text-align: center%3b'%3e%3cspan class='nodeLabel'%3e%3cp%3ePostgreSQL%3cbr /%3eSELECT ... WHERE ...%3cbr /%3e4795ms%3c/p%3e%3c/span%3e%3c/div%3e%3c/foreignObject%3e%3c/g%3e%3c/g%3e%3c/g%3e%3c/g%3e%3c/g%3e%3cdefs%3e%3cfilter id='mermaid-1-drop-shadow' height='130%25' width='130%25'%3e%3cfeDropShadow dx='4' dy='4' stdDeviation='0' flood-opacity='0.06' flood-color='black'/%3e%3c/filter%3e%3c/defs%3e%3cdefs%3e%3cfilter id='mermaid-1-drop-shadow-small' height='150%25' width='150%25'%3e%3cfeDropShadow dx='2' dy='2' stdDeviation='0' flood-opacity='0.06' flood-color='black'/%3e%3c/filter%3e%3c/defs%3e%3clinearGradient id='mermaid-1-gradient' gradientUnits='objectBoundingBox' x1='0%25' y1='0%25' x2='100%25' y2='0%25'%3e%3cstop offset='0%25' stop-color='hsl(0%2c 0%25%2c 83.3333333333%25)' stop-opacity='1'/%3e%3cstop offset='100%25' stop-color='hsl(0%2c 0%25%2c 88.9215686275%25)' stop-opacity='1'/%3e%3c/linearGradient%3e%3c/svg%3e)
The API handler and service layer are fast. The repository call takes 4800ms, and the SQL query itself takes 4795ms. The trace pinpoints the problem to a specific query. You check the query plan, find a missing index on catalog.tenant_id + catalog.title, add it, and the query drops to 12ms.
Without tracing, you would have added caching, increased timeouts, scaled horizontally — all wrong fixes for a missing index.
Prometheus Metrics
Traces are for individual request debugging. Metrics are for aggregate system health: how many requests per second, what is the error rate, what is p99 latency.
Metric Types
from prometheus_client import Counter, Histogram, Gauge
# Request metricsREQUEST_COUNT = Counter(    "http_requests_total",    "Total HTTP requests",    labelnames=["method", "endpoint", "status", "tenant_id"],)
REQUEST_DURATION = Histogram(    "http_request_duration_seconds",    "Request duration in seconds",    labelnames=["method", "endpoint", "tenant_id"],    buckets=[0.01, 0.025, 0.05, 0.1, 0.25, 0.5, 1.0, 2.5, 5.0, 10.0],)
# Business metricsORDERS_CREATED = Counter(    "orders_created_total",    "Total orders created",    labelnames=["tenant_id"],)
ORDER_REVENUE = Counter(    "order_revenue_dollars_total",    "Total revenue in dollars",    labelnames=["tenant_id"],)
# Infrastructure metricsDB_POOL_SIZE = Gauge(    "db_pool_connections_active",    "Active database pool connections",    labelnames=["tenant_id"],)
Recording Metrics in Middleware
# src/middleware/observability.py (extended)from src.observability.metrics import REQUEST_COUNT, REQUEST_DURATION

class ObservabilityMiddleware(BaseHTTPMiddleware):    async def dispatch(        self,        request: Request,        call_next: Callable[[Request], Awaitable[Response]],    ) -> Response:        request_id = request.headers.get("X-Request-ID", str(uuid.uuid4()))        tenant_id = TenantContext.get()
        structlog.contextvars.clear_contextvars()        structlog.contextvars.bind_contextvars(            request_id=request_id,            tenant_id=tenant_id,        )
        start = time.perf_counter()        try:            response = await call_next(request)        except Exception:            REQUEST_COUNT.labels(                method=request.method,                endpoint=request.url.path,                status="500",                tenant_id=tenant_id,            ).inc()            raise
        duration = time.perf_counter() - start
        REQUEST_COUNT.labels(            method=request.method,            endpoint=request.url.path,            status=str(response.status_code),            tenant_id=tenant_id,        ).inc()
        REQUEST_DURATION.labels(            method=request.method,            endpoint=request.url.path,            tenant_id=tenant_id,        ).observe(duration)
        return response
Business Metrics in Services
# src/services/order_service.py (extended)from src.observability.metrics import ORDERS_CREATED, ORDER_REVENUE

class OrderService:    async def create_order(self, data: OrderCreate) -> OrderResponse:        order = await self._persist_order(data)
        ORDERS_CREATED.labels(tenant_id=data.tenant_id).inc()        ORDER_REVENUE.labels(tenant_id=data.tenant_id).inc(            float(order.total)        )
        return order
Business metrics answer questions that infrastructure metrics cannot: “How many orders did Powell’s Books process today?” and “Is revenue per tenant trending down this week?” These are the metrics your product team cares about.
Log Levels as a Production Tool
Log levels are not just severity markers. They are a production control knob. Set the global level to INFO in production and adjust per-tenant when debugging.
# src/observability/logging.py (extended)
# Per-tenant log level overrides stored in config (Part 10)_tenant_log_overrides: dict[str, str] = {}

def set_tenant_log_level(tenant_id: str, level: str) -> None:    """Override log level for a specific tenant. Used for live debugging."""    _tenant_log_overrides[tenant_id] = level.upper()

def clear_tenant_log_level(tenant_id: str) -> None:    """Remove tenant-specific log level override."""    _tenant_log_overrides.pop(tenant_id, None)

def tenant_level_filter(    logger: structlog.types.WrappedLogger,    method_name: str,    event_dict: structlog.types.EventDict,) -> structlog.types.EventDict:    """Drop log events below the tenant-specific override level."""    tenant_id = event_dict.get("tenant_id")    if tenant_id and tenant_id in _tenant_log_overrides:        override = _tenant_log_overrides[tenant_id]        level_map = {"DEBUG": 10, "INFO": 20, "WARNING": 30, "ERROR": 40}        current_level = level_map.get(event_dict.get("level", "INFO").upper(), 20)        required_level = level_map.get(override, 20)        if current_level < required_level:            raise structlog.DropEvent    return event_dict
When Powell’s Books reports a problem, you call set_tenant_log_level("powells", "DEBUG") via an admin endpoint. DEBUG logs start flowing for that tenant only — every other tenant stays at INFO. You diagnose the issue and call clear_tenant_log_level("powells"). No restart, no redeployment, no flood of debug logs from 500 other tenants.
Alerting Thresholds
Metrics are useless without alerts. Define thresholds that catch real problems before tenants report them:
| Metric | Threshold | Severity | Action |
|---|---|---|---|
| Error rate (5xx) | > 1% over 5 minutes | Critical | Page on-call, check error logs by tenant |
| p99 latency | > 2 seconds | Warning | Check traces for slow queries or external calls |
| DB pool utilization | > 80% active connections | Warning | Review pool sizing from Part 11, check for connection leaks |
| Order creation failures | > 5 per minute per tenant | Critical | Check payment gateway health, inventory service |
| Background task dead letters | > 0 in 15 minutes | Warning | Review dead letter queue, check task idempotency |
Connecting the Three Pillars
The power of observability is the connection between pillars. A metric spike leads to traces, traces lead to logs:
%3b%7d%23mermaid-2 .cluster rect%7bfill:hsl(0%2c 0%25%2c 98.9215686275%25)%3bstroke:%23707070%3bstroke-width:1px%3b%7d%23mermaid-2 .cluster text%7bfill:%23333%3b%7d%23mermaid-2 .cluster span%7bcolor:%23333%3b%7d%23mermaid-2 div.mermaidTooltip%7bposition:absolute%3btext-align:center%3bmax-width:200px%3bpadding:2px%3bfont-family:arial%2csans-serif%3bfont-size:12px%3bbackground:hsl(-160%2c 0%25%2c 93.3333333333%25)%3bborder:1px solid %23707070%3bborder-radius:2px%3bpointer-events:none%3bz-index:100%3b%7d%23mermaid-2 .flowchartTitleText%7btext-anchor:middle%3bfont-size:18px%3bfill:black%3b%7d%23mermaid-2 rect.text%7bfill:none%3bstroke-width:0%3b%7d%23mermaid-2 .icon-shape%2c%23mermaid-2 .image-shape%7bbackground-color:white%3btext-align:center%3b%7d%23mermaid-2 .icon-shape p%2c%23mermaid-2 .image-shape p%7bbackground-color:white%3bpadding:2px%3b%7d%23mermaid-2 .icon-shape .label rect%2c%23mermaid-2 .image-shape .label rect%7bopacity:0.5%3bbackground-color:white%3bfill:white%3b%7d%23mermaid-2 .label-icon%7bdisplay:inline-block%3bheight:1em%3boverflow:visible%3bvertical-align:-0.125em%3b%7d%23mermaid-2 .node .label-icon path%7bfill:currentColor%3bstroke:revert%3bstroke-width:revert%3b%7d%23mermaid-2 .node .neo-node%7bstroke:%23999%3b%7d%23mermaid-2 %5bdata-look='neo'%5d.node rect%2c%23mermaid-2 %5bdata-look='neo'%5d.cluster rect%2c%23mermaid-2 %5bdata-look='neo'%5d.node polygon%7bstroke:url(%23mermaid-2-gradient)%3bfilter:drop-shadow( 1px 2px 2px rgba(185%2c185%2c185%2c1))%3b%7d%23mermaid-2 %5bdata-look='neo'%5d.node path%7bstroke:url(%23mermaid-2-gradient)%3bstroke-width:1px%3b%7d%23mermaid-2 %5bdata-look='neo'%5d.node .outer-path%7bfilter:drop-shadow( 1px 2px 2px rgba(185%2c185%2c185%2c1))%3b%7d%23mermaid-2 %5bdata-look='neo'%5d.node .neo-line path%7bstroke:%23999%3bfilter:none%3b%7d%23mermaid-2 %5bdata-look='neo'%5d.node circle%7bstroke:url(%23mermaid-2-gradient)%3bfilter:drop-shadow( 1px 2px 2px rgba(185%2c185%2c185%2c1))%3b%7d%23mermaid-2 %5bdata-look='neo'%5d.node circle .state-start%7bfill:black%3b%7d%23mermaid-2 %5bdata-look='neo'%5d.icon-shape .icon%7bfill:url(%23mermaid-2-gradient)%3bfilter:drop-shadow( 1px 2px 2px rgba(185%2c185%2c185%2c1))%3b%7d%23mermaid-2 %5bdata-look='neo'%5d.icon-shape .icon-neo path%7bstroke:url(%23mermaid-2-gradient)%3bfilter:drop-shadow( 1px 2px 2px rgba(185%2c185%2c185%2c1))%3b%7d%23mermaid-2 :root%7b--mermaid-font-family:arial%2csans-serif%3b%7d%3c/style%3e%3cg%3e%3cmarker id='mermaid-2_flowchart-v2-pointEnd' class='marker flowchart-v2' viewBox='0 0 10 10' refX='5' refY='5' markerUnits='userSpaceOnUse' markerWidth='8' markerHeight='8' orient='auto'%3e%3cpath d='M 0 0 L 10 5 L 0 10 z' class='arrowMarkerPath' style='stroke-width: 1%3b stroke-dasharray: 1%2c 0%3b'/%3e%3c/marker%3e%3cmarker id='mermaid-2_flowchart-v2-pointStart' class='marker flowchart-v2' viewBox='0 0 10 10' refX='4.5' refY='5' markerUnits='userSpaceOnUse' markerWidth='8' markerHeight='8' orient='auto'%3e%3cpath d='M 0 5 L 10 10 L 10 0 z' class='arrowMarkerPath' style='stroke-width: 1%3b stroke-dasharray: 1%2c 0%3b'/%3e%3c/marker%3e%3cmarker id='mermaid-2_flowchart-v2-pointEnd-margin' class='marker flowchart-v2' viewBox='0 0 11.5 14' refX='11.5' refY='7' markerUnits='userSpaceOnUse' markerWidth='10.5' markerHeight='14' orient='auto'%3e%3cpath d='M 0 0 L 11.5 7 L 0 14 z' class='arrowMarkerPath' style='stroke-width: 0%3b stroke-dasharray: 1%2c 0%3b'/%3e%3c/marker%3e%3cmarker id='mermaid-2_flowchart-v2-pointStart-margin' class='marker flowchart-v2' viewBox='0 0 11.5 14' refX='1' refY='7' markerUnits='userSpaceOnUse' markerWidth='11.5' markerHeight='14' orient='auto'%3e%3cpolygon points='0%2c7 11.5%2c14 11.5%2c0' class='arrowMarkerPath' style='stroke-width: 0%3b stroke-dasharray: 1%2c 0%3b'/%3e%3c/marker%3e%3cmarker id='mermaid-2_flowchart-v2-circleEnd' class='marker flowchart-v2' viewBox='0 0 10 10' refX='11' refY='5' markerUnits='userSpaceOnUse' markerWidth='11' markerHeight='11' orient='auto'%3e%3ccircle cx='5' cy='5' r='5' class='arrowMarkerPath' style='stroke-width: 1%3b stroke-dasharray: 1%2c 0%3b'/%3e%3c/marker%3e%3cmarker id='mermaid-2_flowchart-v2-circleStart' class='marker flowchart-v2' viewBox='0 0 10 10' refX='-1' refY='5' markerUnits='userSpaceOnUse' markerWidth='11' markerHeight='11' orient='auto'%3e%3ccircle cx='5' cy='5' r='5' class='arrowMarkerPath' style='stroke-width: 1%3b stroke-dasharray: 1%2c 0%3b'/%3e%3c/marker%3e%3cmarker id='mermaid-2_flowchart-v2-circleEnd-margin' class='marker flowchart-v2' viewBox='0 0 10 10' refY='5' refX='12.25' markerUnits='userSpaceOnUse' markerWidth='14' markerHeight='14' orient='auto'%3e%3ccircle cx='5' cy='5' r='5' class='arrowMarkerPath' style='stroke-width: 0%3b stroke-dasharray: 1%2c 0%3b'/%3e%3c/marker%3e%3cmarker id='mermaid-2_flowchart-v2-circleStart-margin' class='marker flowchart-v2' viewBox='0 0 10 10' refX='-2' refY='5' markerUnits='userSpaceOnUse' markerWidth='14' markerHeight='14' orient='auto'%3e%3ccircle cx='5' cy='5' r='5' class='arrowMarkerPath' style='stroke-width: 0%3b stroke-dasharray: 1%2c 0%3b'/%3e%3c/marker%3e%3cmarker id='mermaid-2_flowchart-v2-crossEnd' class='marker cross flowchart-v2' viewBox='0 0 11 11' refX='12' refY='5.2' markerUnits='userSpaceOnUse' markerWidth='11' markerHeight='11' orient='auto'%3e%3cpath d='M 1%2c1 l 9%2c9 M 10%2c1 l -9%2c9' class='arrowMarkerPath' style='stroke-width: 2%3b stroke-dasharray: 1%2c 0%3b'/%3e%3c/marker%3e%3cmarker id='mermaid-2_flowchart-v2-crossStart' class='marker cross flowchart-v2' viewBox='0 0 11 11' refX='-1' refY='5.2' markerUnits='userSpaceOnUse' markerWidth='11' markerHeight='11' orient='auto'%3e%3cpath d='M 1%2c1 l 9%2c9 M 10%2c1 l -9%2c9' class='arrowMarkerPath' style='stroke-width: 2%3b stroke-dasharray: 1%2c 0%3b'/%3e%3c/marker%3e%3cmarker id='mermaid-2_flowchart-v2-crossEnd-margin' class='marker cross flowchart-v2' viewBox='0 0 15 15' refX='17.7' refY='7.5' markerUnits='userSpaceOnUse' markerWidth='12' markerHeight='12' orient='auto'%3e%3cpath d='M 1%2c1 L 14%2c14 M 1%2c14 L 14%2c1' class='arrowMarkerPath' style='stroke-width: 2.5%3b'/%3e%3c/marker%3e%3cmarker id='mermaid-2_flowchart-v2-crossStart-margin' class='marker cross flowchart-v2' viewBox='0 0 15 15' refX='-3.5' refY='7.5' markerUnits='userSpaceOnUse' markerWidth='12' markerHeight='12' orient='auto'%3e%3cpath d='M 1%2c1 L 14%2c14 M 1%2c14 L 14%2c1' class='arrowMarkerPath' style='stroke-width: 2.5%3b stroke-dasharray: 1%2c 0%3b'/%3e%3c/marker%3e%3cg class='root'%3e%3cg class='clusters'/%3e%3cg class='edgePaths'%3e%3cpath d='M259.688%2c71L263.854%2c71C268.021%2c71%2c276.354%2c71%2c284.021%2c71C291.688%2c71%2c298.688%2c71%2c302.188%2c71L305.688%2c71' id='mermaid-2-L_A_B_0' class='edge-thickness-normal edge-pattern-solid edge-thickness-normal edge-pattern-solid flowchart-link' style='%3b' data-edge='true' data-et='edge' data-id='L_A_B_0' data-points='W3sieCI6MjU5LjY4NzUsInkiOjcxfSx7IngiOjI4NC42ODc1LCJ5Ijo3MX0seyJ4IjozMDkuNjg3NSwieSI6NzF9XQ==' data-look='classic' marker-end='url(%23mermaid-2_flowchart-v2-pointEnd)'/%3e%3cpath d='M498.234%2c71L502.401%2c71C506.568%2c71%2c514.901%2c71%2c522.568%2c71C530.234%2c71%2c537.234%2c71%2c540.734%2c71L544.234%2c71' id='mermaid-2-L_B_C_0' class='edge-thickness-normal edge-pattern-solid edge-thickness-normal edge-pattern-solid flowchart-link' style='%3b' data-edge='true' data-et='edge' data-id='L_B_C_0' data-points='W3sieCI6NDk4LjIzNDM3NSwieSI6NzF9LHsieCI6NTIzLjIzNDM3NSwieSI6NzF9LHsieCI6NTQ4LjIzNDM3NSwieSI6NzF9XQ==' data-look='classic' marker-end='url(%23mermaid-2_flowchart-v2-pointEnd)'/%3e%3cpath d='M778.109%2c71L782.276%2c71C786.443%2c71%2c794.776%2c71%2c802.443%2c71C810.109%2c71%2c817.109%2c71%2c820.609%2c71L824.109%2c71' id='mermaid-2-L_C_D_0' class='edge-thickness-normal edge-pattern-solid edge-thickness-normal edge-pattern-solid flowchart-link' style='%3b' data-edge='true' data-et='edge' data-id='L_C_D_0' data-points='W3sieCI6Nzc4LjEwOTM3NSwieSI6NzF9LHsieCI6ODAzLjEwOTM3NSwieSI6NzF9LHsieCI6ODI4LjEwOTM3NSwieSI6NzF9XQ==' data-look='classic' marker-end='url(%23mermaid-2_flowchart-v2-pointEnd)'/%3e%3cpath d='M1006.875%2c71L1011.042%2c71C1015.208%2c71%2c1023.542%2c71%2c1031.208%2c71C1038.875%2c71%2c1045.875%2c71%2c1049.375%2c71L1052.875%2c71' id='mermaid-2-L_D_E_0' class='edge-thickness-normal edge-pattern-solid edge-thickness-normal edge-pattern-solid flowchart-link' style='%3b' data-edge='true' data-et='edge' data-id='L_D_E_0' data-points='W3sieCI6MTAwNi44NzUsInkiOjcxfSx7IngiOjEwMzEuODc1LCJ5Ijo3MX0seyJ4IjoxMDU2Ljg3NSwieSI6NzF9XQ==' data-look='classic' marker-end='url(%23mermaid-2_flowchart-v2-pointEnd)'/%3e%3c/g%3e%3cg class='edgeLabels'%3e%3cg class='edgeLabel'%3e%3cg class='label' data-id='L_A_B_0' transform='translate(0%2c 0)'%3e%3cforeignObject width='0' height='0'%3e%3cdiv xmlns='http://www.w3.org/1999/xhtml' class='labelBkg' style='display: table-cell%3b white-space: nowrap%3b line-height: 1.5%3b max-width: 200px%3b text-align: center%3b'%3e%3cspan class='edgeLabel'%3e%3c/span%3e%3c/div%3e%3c/foreignObject%3e%3c/g%3e%3c/g%3e%3cg class='edgeLabel'%3e%3cg class='label' data-id='L_B_C_0' transform='translate(0%2c 0)'%3e%3cforeignObject width='0' height='0'%3e%3cdiv xmlns='http://www.w3.org/1999/xhtml' class='labelBkg' style='display: table-cell%3b white-space: nowrap%3b line-height: 1.5%3b max-width: 200px%3b text-align: center%3b'%3e%3cspan class='edgeLabel'%3e%3c/span%3e%3c/div%3e%3c/foreignObject%3e%3c/g%3e%3c/g%3e%3cg class='edgeLabel'%3e%3cg class='label' data-id='L_C_D_0' transform='translate(0%2c 0)'%3e%3cforeignObject width='0' height='0'%3e%3cdiv xmlns='http://www.w3.org/1999/xhtml' class='labelBkg' style='display: table-cell%3b white-space: nowrap%3b line-height: 1.5%3b max-width: 200px%3b text-align: center%3b'%3e%3cspan class='edgeLabel'%3e%3c/span%3e%3c/div%3e%3c/foreignObject%3e%3c/g%3e%3c/g%3e%3cg class='edgeLabel'%3e%3cg class='label' data-id='L_D_E_0' transform='translate(0%2c 0)'%3e%3cforeignObject width='0' height='0'%3e%3cdiv xmlns='http://www.w3.org/1999/xhtml' class='labelBkg' style='display: table-cell%3b white-space: nowrap%3b line-height: 1.5%3b max-width: 200px%3b text-align: center%3b'%3e%3cspan class='edgeLabel'%3e%3c/span%3e%3c/div%3e%3c/foreignObject%3e%3c/g%3e%3c/g%3e%3c/g%3e%3cg class='nodes'%3e%3cg class='node default' id='mermaid-2-flowchart-A-0' data-look='classic' transform='translate(133.84375%2c 71)'%3e%3crect class='basic label-container' style='fill:%23ffcdd2 !important%3bstroke:%23c62828 !important' x='-125.84375' y='-39' width='251.6875' height='78'/%3e%3cg class='label' style='' transform='translate(-95.84375%2c -24)'%3e%3crect/%3e%3cforeignObject width='191.6875' height='48'%3e%3cdiv xmlns='http://www.w3.org/1999/xhtml' style='display: table-cell%3b white-space: nowrap%3b line-height: 1.5%3b max-width: 200px%3b text-align: center%3b'%3e%3cspan class='nodeLabel'%3e%3cp%3eMetric Alert%3cbr /%3ep99 %26gt%3b 2s for tenant powells%3c/p%3e%3c/span%3e%3c/div%3e%3c/foreignObject%3e%3c/g%3e%3c/g%3e%3cg class='node default' id='mermaid-2-flowchart-B-1' data-look='classic' transform='translate(403.9609375%2c 71)'%3e%3crect class='basic label-container' style='' x='-94.2734375' y='-51' width='188.546875' height='102'/%3e%3cg class='label' style='' transform='translate(-64.2734375%2c -36)'%3e%3crect/%3e%3cforeignObject width='128.546875' height='72'%3e%3cdiv xmlns='http://www.w3.org/1999/xhtml' style='display: table-cell%3b white-space: nowrap%3b line-height: 1.5%3b max-width: 200px%3b text-align: center%3b'%3e%3cspan class='nodeLabel'%3e%3cp%3eFilter Traces%3cbr /%3etenant_id=powells%3cbr /%3eduration %26gt%3b 2s%3c/p%3e%3c/span%3e%3c/div%3e%3c/foreignObject%3e%3c/g%3e%3c/g%3e%3cg class='node default' id='mermaid-2-flowchart-C-3' data-look='classic' transform='translate(663.171875%2c 71)'%3e%3crect class='basic label-container' style='' x='-114.9375' y='-51' width='229.875' height='102'/%3e%3cg class='label' style='' transform='translate(-84.9375%2c -36)'%3e%3crect/%3e%3cforeignObject width='169.875' height='72'%3e%3cdiv xmlns='http://www.w3.org/1999/xhtml' style='display: table-cell%3b white-space: nowrap%3b line-height: 1.5%3b max-width: 200px%3b text-align: center%3b'%3e%3cspan class='nodeLabel'%3e%3cp%3eSlow Trace Found%3cbr /%3etrace_id=abc123%3cbr /%3ecatalog.search: 4800ms%3c/p%3e%3c/span%3e%3c/div%3e%3c/foreignObject%3e%3c/g%3e%3c/g%3e%3cg class='node default' id='mermaid-2-flowchart-D-5' data-look='classic' transform='translate(917.4921875%2c 71)'%3e%3crect class='basic label-container' style='' x='-89.3828125' y='-39' width='178.765625' height='78'/%3e%3cg class='label' style='' transform='translate(-59.3828125%2c -24)'%3e%3crect/%3e%3cforeignObject width='118.765625' height='48'%3e%3cdiv xmlns='http://www.w3.org/1999/xhtml' style='display: table-cell%3b white-space: nowrap%3b line-height: 1.5%3b max-width: 200px%3b text-align: center%3b'%3e%3cspan class='nodeLabel'%3e%3cp%3eFilter Logs%3cbr /%3etrace_id=abc123%3c/p%3e%3c/span%3e%3c/div%3e%3c/foreignObject%3e%3c/g%3e%3c/g%3e%3cg class='node default' id='mermaid-2-flowchart-E-7' data-look='classic' transform='translate(1186.875%2c 71)'%3e%3crect class='basic label-container' style='fill:%23e8f5e9 !important%3bstroke:%232e7d32 !important' x='-130' y='-63' width='260' height='126'/%3e%3cg class='label' style='' transform='translate(-100%2c -48)'%3e%3crect/%3e%3cforeignObject width='200' height='96'%3e%3cdiv xmlns='http://www.w3.org/1999/xhtml' style='display: table%3b white-space: break-spaces%3b line-height: 1.5%3b max-width: 200px%3b text-align: center%3b width: 200px%3b'%3e%3cspan class='nodeLabel'%3e%3cp%3eRoot Cause%3cbr /%3eFull table scan on%3cbr /%3ecatalog WHERE tenant_id=...%3c/p%3e%3c/span%3e%3c/div%3e%3c/foreignObject%3e%3c/g%3e%3c/g%3e%3c/g%3e%3c/g%3e%3c/g%3e%3cdefs%3e%3cfilter id='mermaid-2-drop-shadow' height='130%25' width='130%25'%3e%3cfeDropShadow dx='4' dy='4' stdDeviation='0' flood-opacity='0.06' flood-color='black'/%3e%3c/filter%3e%3c/defs%3e%3cdefs%3e%3cfilter id='mermaid-2-drop-shadow-small' height='150%25' width='150%25'%3e%3cfeDropShadow dx='2' dy='2' stdDeviation='0' flood-opacity='0.06' flood-color='black'/%3e%3c/filter%3e%3c/defs%3e%3clinearGradient id='mermaid-2-gradient' gradientUnits='objectBoundingBox' x1='0%25' y1='0%25' x2='100%25' y2='0%25'%3e%3cstop offset='0%25' stop-color='hsl(0%2c 0%25%2c 83.3333333333%25)' stop-opacity='1'/%3e%3cstop offset='100%25' stop-color='hsl(0%2c 0%25%2c 88.9215686275%25)' stop-opacity='1'/%3e%3c/linearGradient%3e%3c/svg%3e)
This workflow takes 30 seconds, not 30 minutes. The metric tells you something is wrong. The trace tells you where. The log tells you why. Without all three connected by shared IDs (request_id, trace_id, tenant_id), you are searching blind.
Tying It Together: Application Startup
# src/main.py (extended)from src.observability.logging import configure_loggingfrom src.observability.tracing import configure_tracingfrom src.middleware.observability import ObservabilityMiddleware
configure_logging(json_output=True, log_level="INFO")configure_tracing(    service_name="shelfwise-api",    otlp_endpoint="http://otel-collector:4317",)
app = FastAPI(title="ShelfWise API")app.add_middleware(ObservabilityMiddleware)
Observability is initialized before the application starts accepting requests. Every request from the first one onward has structured logs, distributed traces, and Prometheus metrics.
Key Takeaways
- structlog with contextvars binds
tenant_id,request_id, andtrace_idonce in middleware. Every log line in the request includes them automatically — no logger passing required. - OpenTelemetry auto-instrumentation gives you spans for FastAPI, SQLAlchemy, httpx, and Redis with zero manual code. Add custom spans only for business operations.
- Prometheus metrics with tenant labels answer “how many” and “how fast” per tenant. Business metrics (orders, revenue) are as important as infrastructure metrics (latency, error rate).
- Per-tenant log level overrides let you enable DEBUG logging for one tenant without drowning in logs from 500 others. No restart required.
- Connect the three pillars with shared correlation IDs. A metric alert leads to a trace, a trace leads to logs, and the root cause is found in 30 seconds.
Next: Part 13 covers caching architecture — Redis, invalidation strategies, and the critical requirement of tenant-scoped cache keys.