An N+1 query that takes 50ms with 10 results takes 5 seconds with 1,000. A memory leak that grows 1MB per hour kills your server in 3 days. A JSON serialization bottleneck that is invisible at 100 items dominates your response time at 50,000.
You cannot optimize what you cannot measure, and you cannot trust an optimization that has not been verified under realistic multi-tenant load. This post covers the full performance lifecycle: profiling in production, detecting N+1 queries automatically, optimizing the critical path, and load testing under conditions that match what your tenants actually do.
The Performance Investigation Workflow
Before optimizing anything, you need a repeatable process for finding what is actually slow. Guessing is how you spend a week optimizing JSON serialization when the real bottleneck is a missing index.
%3b%7d%23mermaid-0 .cluster rect%7bfill:hsl(0%2c 0%25%2c 98.9215686275%25)%3bstroke:%23707070%3bstroke-width:1px%3b%7d%23mermaid-0 .cluster text%7bfill:%23333%3b%7d%23mermaid-0 .cluster span%7bcolor:%23333%3b%7d%23mermaid-0 div.mermaidTooltip%7bposition:absolute%3btext-align:center%3bmax-width:200px%3bpadding:2px%3bfont-family:arial%2csans-serif%3bfont-size:12px%3bbackground:hsl(-160%2c 0%25%2c 93.3333333333%25)%3bborder:1px solid %23707070%3bborder-radius:2px%3bpointer-events:none%3bz-index:100%3b%7d%23mermaid-0 .flowchartTitleText%7btext-anchor:middle%3bfont-size:18px%3bfill:black%3b%7d%23mermaid-0 rect.text%7bfill:none%3bstroke-width:0%3b%7d%23mermaid-0 .icon-shape%2c%23mermaid-0 .image-shape%7bbackground-color:white%3btext-align:center%3b%7d%23mermaid-0 .icon-shape p%2c%23mermaid-0 .image-shape p%7bbackground-color:white%3bpadding:2px%3b%7d%23mermaid-0 .icon-shape .label rect%2c%23mermaid-0 .image-shape .label rect%7bopacity:0.5%3bbackground-color:white%3bfill:white%3b%7d%23mermaid-0 .label-icon%7bdisplay:inline-block%3bheight:1em%3boverflow:visible%3bvertical-align:-0.125em%3b%7d%23mermaid-0 .node .label-icon path%7bfill:currentColor%3bstroke:revert%3bstroke-width:revert%3b%7d%23mermaid-0 .node .neo-node%7bstroke:%23999%3b%7d%23mermaid-0 %5bdata-look='neo'%5d.node rect%2c%23mermaid-0 %5bdata-look='neo'%5d.cluster rect%2c%23mermaid-0 %5bdata-look='neo'%5d.node polygon%7bstroke:url(%23mermaid-0-gradient)%3bfilter:drop-shadow( 1px 2px 2px rgba(185%2c185%2c185%2c1))%3b%7d%23mermaid-0 %5bdata-look='neo'%5d.node path%7bstroke:url(%23mermaid-0-gradient)%3bstroke-width:1px%3b%7d%23mermaid-0 %5bdata-look='neo'%5d.node .outer-path%7bfilter:drop-shadow( 1px 2px 2px rgba(185%2c185%2c185%2c1))%3b%7d%23mermaid-0 %5bdata-look='neo'%5d.node .neo-line path%7bstroke:%23999%3bfilter:none%3b%7d%23mermaid-0 %5bdata-look='neo'%5d.node circle%7bstroke:url(%23mermaid-0-gradient)%3bfilter:drop-shadow( 1px 2px 2px rgba(185%2c185%2c185%2c1))%3b%7d%23mermaid-0 %5bdata-look='neo'%5d.node circle .state-start%7bfill:black%3b%7d%23mermaid-0 %5bdata-look='neo'%5d.icon-shape .icon%7bfill:url(%23mermaid-0-gradient)%3bfilter:drop-shadow( 1px 2px 2px rgba(185%2c185%2c185%2c1))%3b%7d%23mermaid-0 %5bdata-look='neo'%5d.icon-shape .icon-neo path%7bstroke:url(%23mermaid-0-gradient)%3bfilter:drop-shadow( 1px 2px 2px rgba(185%2c185%2c185%2c1))%3b%7d%23mermaid-0 :root%7b--mermaid-font-family:arial%2csans-serif%3b%7d%3c/style%3e%3cg%3e%3cmarker id='mermaid-0_flowchart-v2-pointEnd' class='marker flowchart-v2' viewBox='0 0 10 10' refX='5' refY='5' markerUnits='userSpaceOnUse' markerWidth='8' markerHeight='8' orient='auto'%3e%3cpath d='M 0 0 L 10 5 L 0 10 z' class='arrowMarkerPath' style='stroke-width: 1%3b stroke-dasharray: 1%2c 0%3b'/%3e%3c/marker%3e%3cmarker id='mermaid-0_flowchart-v2-pointStart' class='marker flowchart-v2' viewBox='0 0 10 10' refX='4.5' refY='5' markerUnits='userSpaceOnUse' markerWidth='8' markerHeight='8' orient='auto'%3e%3cpath d='M 0 5 L 10 10 L 10 0 z' class='arrowMarkerPath' style='stroke-width: 1%3b stroke-dasharray: 1%2c 0%3b'/%3e%3c/marker%3e%3cmarker id='mermaid-0_flowchart-v2-pointEnd-margin' class='marker flowchart-v2' viewBox='0 0 11.5 14' refX='11.5' refY='7' markerUnits='userSpaceOnUse' markerWidth='10.5' markerHeight='14' orient='auto'%3e%3cpath d='M 0 0 L 11.5 7 L 0 14 z' class='arrowMarkerPath' style='stroke-width: 0%3b stroke-dasharray: 1%2c 0%3b'/%3e%3c/marker%3e%3cmarker id='mermaid-0_flowchart-v2-pointStart-margin' class='marker flowchart-v2' viewBox='0 0 11.5 14' refX='1' refY='7' markerUnits='userSpaceOnUse' markerWidth='11.5' markerHeight='14' orient='auto'%3e%3cpolygon points='0%2c7 11.5%2c14 11.5%2c0' class='arrowMarkerPath' style='stroke-width: 0%3b stroke-dasharray: 1%2c 0%3b'/%3e%3c/marker%3e%3cmarker id='mermaid-0_flowchart-v2-circleEnd' class='marker flowchart-v2' viewBox='0 0 10 10' refX='11' refY='5' markerUnits='userSpaceOnUse' markerWidth='11' markerHeight='11' orient='auto'%3e%3ccircle cx='5' cy='5' r='5' class='arrowMarkerPath' style='stroke-width: 1%3b stroke-dasharray: 1%2c 0%3b'/%3e%3c/marker%3e%3cmarker id='mermaid-0_flowchart-v2-circleStart' class='marker flowchart-v2' viewBox='0 0 10 10' refX='-1' refY='5' markerUnits='userSpaceOnUse' markerWidth='11' markerHeight='11' orient='auto'%3e%3ccircle cx='5' cy='5' r='5' class='arrowMarkerPath' style='stroke-width: 1%3b stroke-dasharray: 1%2c 0%3b'/%3e%3c/marker%3e%3cmarker id='mermaid-0_flowchart-v2-circleEnd-margin' class='marker flowchart-v2' viewBox='0 0 10 10' refY='5' refX='12.25' markerUnits='userSpaceOnUse' markerWidth='14' markerHeight='14' orient='auto'%3e%3ccircle cx='5' cy='5' r='5' class='arrowMarkerPath' style='stroke-width: 0%3b stroke-dasharray: 1%2c 0%3b'/%3e%3c/marker%3e%3cmarker id='mermaid-0_flowchart-v2-circleStart-margin' class='marker flowchart-v2' viewBox='0 0 10 10' refX='-2' refY='5' markerUnits='userSpaceOnUse' markerWidth='14' markerHeight='14' orient='auto'%3e%3ccircle cx='5' cy='5' r='5' class='arrowMarkerPath' style='stroke-width: 0%3b stroke-dasharray: 1%2c 0%3b'/%3e%3c/marker%3e%3cmarker id='mermaid-0_flowchart-v2-crossEnd' class='marker cross flowchart-v2' viewBox='0 0 11 11' refX='12' refY='5.2' markerUnits='userSpaceOnUse' markerWidth='11' markerHeight='11' orient='auto'%3e%3cpath d='M 1%2c1 l 9%2c9 M 10%2c1 l -9%2c9' class='arrowMarkerPath' style='stroke-width: 2%3b stroke-dasharray: 1%2c 0%3b'/%3e%3c/marker%3e%3cmarker id='mermaid-0_flowchart-v2-crossStart' class='marker cross flowchart-v2' viewBox='0 0 11 11' refX='-1' refY='5.2' markerUnits='userSpaceOnUse' markerWidth='11' markerHeight='11' orient='auto'%3e%3cpath d='M 1%2c1 l 9%2c9 M 10%2c1 l -9%2c9' class='arrowMarkerPath' style='stroke-width: 2%3b stroke-dasharray: 1%2c 0%3b'/%3e%3c/marker%3e%3cmarker id='mermaid-0_flowchart-v2-crossEnd-margin' class='marker cross flowchart-v2' viewBox='0 0 15 15' refX='17.7' refY='7.5' markerUnits='userSpaceOnUse' markerWidth='12' markerHeight='12' orient='auto'%3e%3cpath d='M 1%2c1 L 14%2c14 M 1%2c14 L 14%2c1' class='arrowMarkerPath' style='stroke-width: 2.5%3b'/%3e%3c/marker%3e%3cmarker id='mermaid-0_flowchart-v2-crossStart-margin' class='marker cross flowchart-v2' viewBox='0 0 15 15' refX='-3.5' refY='7.5' markerUnits='userSpaceOnUse' markerWidth='12' markerHeight='12' orient='auto'%3e%3cpath d='M 1%2c1 L 14%2c14 M 1%2c14 L 14%2c1' class='arrowMarkerPath' style='stroke-width: 2.5%3b stroke-dasharray: 1%2c 0%3b'/%3e%3c/marker%3e%3cg class='root'%3e%3cg class='clusters'/%3e%3cg class='edgePaths'%3e%3cpath d='M496.809%2c62L496.809%2c66.167C496.809%2c70.333%2c496.809%2c78.667%2c496.809%2c86.333C496.809%2c94%2c496.809%2c101%2c496.809%2c104.5L496.809%2c108' id='mermaid-0-L_Alert_Trace_0' class='edge-thickness-normal edge-pattern-solid edge-thickness-normal edge-pattern-solid flowchart-link' style='%3b' data-edge='true' data-et='edge' data-id='L_Alert_Trace_0' data-points='W3sieCI6NDk2LjgwODU5Mzc1LCJ5Ijo2Mn0seyJ4Ijo0OTYuODA4NTkzNzUsInkiOjg3fSx7IngiOjQ5Ni44MDg1OTM3NSwieSI6MTEyfV0=' data-look='classic' marker-end='url(%23mermaid-0_flowchart-v2-pointEnd)'/%3e%3cpath d='M496.809%2c190L496.809%2c194.167C496.809%2c198.333%2c496.809%2c206.667%2c496.809%2c214.333C496.809%2c222%2c496.809%2c229%2c496.809%2c232.5L496.809%2c236' id='mermaid-0-L_Trace_Identify_0' class='edge-thickness-normal edge-pattern-solid edge-thickness-normal edge-pattern-solid flowchart-link' style='%3b' data-edge='true' data-et='edge' data-id='L_Trace_Identify_0' data-points='W3sieCI6NDk2LjgwODU5Mzc1LCJ5IjoxOTB9LHsieCI6NDk2LjgwODU5Mzc1LCJ5IjoyMTV9LHsieCI6NDk2LjgwODU5Mzc1LCJ5IjoyNDB9XQ==' data-look='classic' marker-end='url(%23mermaid-0_flowchart-v2-pointEnd)'/%3e%3cpath d='M496.809%2c294L496.809%2c298.167C496.809%2c302.333%2c496.809%2c310.667%2c496.809%2c318.333C496.809%2c326%2c496.809%2c333%2c496.809%2c336.5L496.809%2c340' id='mermaid-0-L_Identify_DB_0' class='edge-thickness-normal edge-pattern-solid edge-thickness-normal edge-pattern-solid flowchart-link' style='%3b' data-edge='true' data-et='edge' data-id='L_Identify_DB_0' data-points='W3sieCI6NDk2LjgwODU5Mzc1LCJ5IjoyOTR9LHsieCI6NDk2LjgwODU5Mzc1LCJ5IjozMTl9LHsieCI6NDk2LjgwODU5Mzc1LCJ5IjozNDR9XQ==' data-look='classic' marker-end='url(%23mermaid-0_flowchart-v2-pointEnd)'/%3e%3cpath d='M432.014%2c449.737L378.315%2c466.703C324.616%2c483.668%2c217.218%2c517.6%2c163.519%2c552.941C109.82%2c588.281%2c109.82%2c625.031%2c109.82%2c661.781C109.82%2c698.531%2c109.82%2c735.281%2c109.82%2c773.363C109.82%2c811.445%2c109.82%2c850.859%2c109.82%2c890.273C109.82%2c929.688%2c109.82%2c969.102%2c109.82%2c994.309C109.82%2c1019.516%2c109.82%2c1030.516%2c109.82%2c1036.016L109.82%2c1041.516' id='mermaid-0-L_DB_Explain_0' class='edge-thickness-normal edge-pattern-solid edge-thickness-normal edge-pattern-solid flowchart-link' style='%3b' data-edge='true' data-et='edge' data-id='L_DB_Explain_0' data-points='W3sieCI6NDMyLjAxNDIwMDg4NzI0MTIsInkiOjQ0OS43MzY4NTcxMzcyNDEyfSx7IngiOjEwOS44MjAzMTI1LCJ5Ijo1NTEuNTMxMjV9LHsieCI6MTA5LjgyMDMxMjUsInkiOjY2MS43ODEyNX0seyJ4IjoxMDkuODIwMzEyNSwieSI6NzcyLjAzMTI1fSx7IngiOjEwOS44MjAzMTI1LCJ5Ijo4OTAuMjczNDM3NX0seyJ4IjoxMDkuODIwMzEyNSwieSI6MTAwOC41MTU2MjV9LHsieCI6MTA5LjgyMDMxMjUsInkiOjEwNDUuNTE1NjI1fV0=' data-look='classic' marker-end='url(%23mermaid-0_flowchart-v2-pointEnd)'/%3e%3cpath d='M539.9%2c471.44L553.539%2c484.788C567.178%2c498.137%2c594.456%2c524.834%2c608.095%2c543.683C621.734%2c562.531%2c621.734%2c573.531%2c621.734%2c579.031L621.734%2c584.531' id='mermaid-0-L_DB_CPU_0' class='edge-thickness-normal edge-pattern-solid edge-thickness-normal edge-pattern-solid flowchart-link' style='%3b' data-edge='true' data-et='edge' data-id='L_DB_CPU_0' data-points='W3sieCI6NTM5LjkwMDIwMDI4NDc0MTksInkiOjQ3MS40Mzk2NDM0NjUyNTgxNH0seyJ4Ijo2MjEuNzM0Mzc1LCJ5Ijo1NTEuNTMxMjV9LHsieCI6NjIxLjczNDM3NSwieSI6NTg4LjUzMTI1fV0=' data-look='classic' marker-end='url(%23mermaid-0_flowchart-v2-pointEnd)'/%3e%3cpath d='M570.175%2c683.472L535.091%2c698.232C500.008%2c712.992%2c429.84%2c742.512%2c394.756%2c776.978C359.672%2c811.445%2c359.672%2c850.859%2c359.672%2c890.273C359.672%2c929.688%2c359.672%2c969.102%2c359.672%2c996.309C359.672%2c1023.516%2c359.672%2c1038.516%2c359.672%2c1046.016L359.672%2c1053.516' id='mermaid-0-L_CPU_Profile_0' class='edge-thickness-normal edge-pattern-solid edge-thickness-normal edge-pattern-solid flowchart-link' style='%3b' data-edge='true' data-et='edge' data-id='L_CPU_Profile_0' data-points='W3sieCI6NTcwLjE3NTMyNjgyMTM4NjYsInkiOjY4My40NzIyMDE4MjEzODY2fSx7IngiOjM1OS42NzE4NzUsInkiOjc3Mi4wMzEyNX0seyJ4IjozNTkuNjcxODc1LCJ5Ijo4OTAuMjczNDM3NX0seyJ4IjozNTkuNjcxODc1LCJ5IjoxMDA4LjUxNTYyNX0seyJ4IjozNTkuNjcxODc1LCJ5IjoxMDU3LjUxNTYyNX1d' data-look='classic' marker-end='url(%23mermaid-0_flowchart-v2-pointEnd)'/%3e%3cpath d='M661.576%2c695.19L676.848%2c707.997C692.121%2c720.804%2c722.666%2c746.418%2c737.938%2c764.724C753.211%2c783.031%2c753.211%2c794.031%2c753.211%2c799.531L753.211%2c805.031' id='mermaid-0-L_CPU_Memory_0' class='edge-thickness-normal edge-pattern-solid edge-thickness-normal edge-pattern-solid flowchart-link' style='%3b' data-edge='true' data-et='edge' data-id='L_CPU_Memory_0' data-points='W3sieCI6NjYxLjU3NTUwMDA0NDQzOTQsInkiOjY5NS4xOTAxMjQ5NTU1NjA2fSx7IngiOjc1My4yMTA5Mzc1LCJ5Ijo3NzIuMDMxMjV9LHsieCI6NzUzLjIxMDkzNzUsInkiOjgwOS4wMzEyNX1d' data-look='classic' marker-end='url(%23mermaid-0_flowchart-v2-pointEnd)'/%3e%3cpath d='M710.575%2c928.879L695.916%2c942.152C681.258%2c955.425%2c651.942%2c981.97%2c637.283%2c1002.743C622.625%2c1023.516%2c622.625%2c1038.516%2c622.625%2c1046.016L622.625%2c1053.516' id='mermaid-0-L_Memory_Memray_0' class='edge-thickness-normal edge-pattern-solid edge-thickness-normal edge-pattern-solid flowchart-link' style='%3b' data-edge='true' data-et='edge' data-id='L_Memory_Memray_0' data-points='W3sieCI6NzEwLjU3NDczMTQwNjk4NTgsInkiOjkyOC44Nzk0MTg5MDY5ODU4fSx7IngiOjYyMi42MjUsInkiOjEwMDguNTE1NjI1fSx7IngiOjYyMi42MjUsInkiOjEwNTcuNTE1NjI1fV0=' data-look='classic' marker-end='url(%23mermaid-0_flowchart-v2-pointEnd)'/%3e%3cpath d='M795.847%2c928.879L810.505%2c942.152C825.164%2c955.425%2c854.48%2c981.97%2c869.139%2c1000.743C883.797%2c1019.516%2c883.797%2c1030.516%2c883.797%2c1036.016L883.797%2c1041.516' id='mermaid-0-L_Memory_IO_0' class='edge-thickness-normal edge-pattern-solid edge-thickness-normal edge-pattern-solid flowchart-link' style='%3b' data-edge='true' data-et='edge' data-id='L_Memory_IO_0' data-points='W3sieCI6Nzk1Ljg0NzE0MzU5MzAxNDIsInkiOjkyOC44Nzk0MTg5MDY5ODU4fSx7IngiOjg4My43OTY4NzUsInkiOjEwMDguNTE1NjI1fSx7IngiOjg4My43OTY4NzUsInkiOjEwNDUuNTE1NjI1fV0=' data-look='classic' marker-end='url(%23mermaid-0_flowchart-v2-pointEnd)'/%3e%3cpath d='M109.82%2c1123.516L109.82%2c1127.682C109.82%2c1131.849%2c109.82%2c1140.182%2c162.675%2c1151.557C215.53%2c1162.931%2c321.241%2c1177.346%2c374.096%2c1184.554L426.951%2c1191.761' id='mermaid-0-L_Explain_Fix_0' class='edge-thickness-normal edge-pattern-solid edge-thickness-normal edge-pattern-solid flowchart-link' style='%3b' data-edge='true' data-et='edge' data-id='L_Explain_Fix_0' data-points='W3sieCI6MTA5LjgyMDMxMjUsInkiOjExMjMuNTE1NjI1fSx7IngiOjEwOS44MjAzMTI1LCJ5IjoxMTQ4LjUxNTYyNX0seyJ4Ijo0MzAuOTE0MDYyNSwieSI6MTE5Mi4zMDE3MzQ0MDM4MTA4fV0=' data-look='classic' marker-end='url(%23mermaid-0_flowchart-v2-pointEnd)'/%3e%3cpath d='M359.672%2c1111.516L359.672%2c1117.682C359.672%2c1123.849%2c359.672%2c1136.182%2c370.926%2c1146.8C382.179%2c1157.418%2c404.687%2c1166.319%2c415.941%2c1170.77L427.194%2c1175.221' id='mermaid-0-L_Profile_Fix_0' class='edge-thickness-normal edge-pattern-solid edge-thickness-normal edge-pattern-solid flowchart-link' style='%3b' data-edge='true' data-et='edge' data-id='L_Profile_Fix_0' data-points='W3sieCI6MzU5LjY3MTg3NSwieSI6MTExMS41MTU2MjV9LHsieCI6MzU5LjY3MTg3NSwieSI6MTE0OC41MTU2MjV9LHsieCI6NDMwLjkxNDA2MjUsInkiOjExNzYuNjkyNDYyNjAxNzU5fV0=' data-look='classic' marker-end='url(%23mermaid-0_flowchart-v2-pointEnd)'/%3e%3cpath d='M622.625%2c1111.516L622.625%2c1117.682C622.625%2c1123.849%2c622.625%2c1136.182%2c611.371%2c1146.8C600.117%2c1157.418%2c577.61%2c1166.319%2c566.356%2c1170.77L555.102%2c1175.221' id='mermaid-0-L_Memray_Fix_0' class='edge-thickness-normal edge-pattern-solid edge-thickness-normal edge-pattern-solid flowchart-link' style='%3b' data-edge='true' data-et='edge' data-id='L_Memray_Fix_0' data-points='W3sieCI6NjIyLjYyNSwieSI6MTExMS41MTU2MjV9LHsieCI6NjIyLjYyNSwieSI6MTE0OC41MTU2MjV9LHsieCI6NTUxLjM4MjgxMjUsInkiOjExNzYuNjkyNDYyNjAxNzU5fV0=' data-look='classic' marker-end='url(%23mermaid-0_flowchart-v2-pointEnd)'/%3e%3cpath d='M883.797%2c1123.516L883.797%2c1127.682C883.797%2c1131.849%2c883.797%2c1140.182%2c829.055%2c1151.599C774.314%2c1163.015%2c664.831%2c1177.514%2c610.09%2c1184.764L555.348%2c1192.013' id='mermaid-0-L_IO_Fix_0' class='edge-thickness-normal edge-pattern-solid edge-thickness-normal edge-pattern-solid flowchart-link' style='%3b' data-edge='true' data-et='edge' data-id='L_IO_Fix_0' data-points='W3sieCI6ODgzLjc5Njg3NSwieSI6MTEyMy41MTU2MjV9LHsieCI6ODgzLjc5Njg3NSwieSI6MTE0OC41MTU2MjV9LHsieCI6NTUxLjM4MjgxMjUsInkiOjExOTIuNTM4NTQ2MjY3ODMyNX1d' data-look='classic' marker-end='url(%23mermaid-0_flowchart-v2-pointEnd)'/%3e%3cpath d='M491.148%2c1227.516L491.148%2c1231.682C491.148%2c1235.849%2c491.148%2c1244.182%2c491.148%2c1251.849C491.148%2c1259.516%2c491.148%2c1266.516%2c491.148%2c1270.016L491.148%2c1273.516' id='mermaid-0-L_Fix_LoadTest_0' class='edge-thickness-normal edge-pattern-solid edge-thickness-normal edge-pattern-solid flowchart-link' style='%3b' data-edge='true' data-et='edge' data-id='L_Fix_LoadTest_0' data-points='W3sieCI6NDkxLjE0ODQzNzUsInkiOjEyMjcuNTE1NjI1fSx7IngiOjQ5MS4xNDg0Mzc1LCJ5IjoxMjUyLjUxNTYyNX0seyJ4Ijo0OTEuMTQ4NDM3NSwieSI6MTI3Ny41MTU2MjV9XQ==' data-look='classic' marker-end='url(%23mermaid-0_flowchart-v2-pointEnd)'/%3e%3cpath d='M491.148%2c1355.516L491.148%2c1359.682C491.148%2c1363.849%2c491.148%2c1372.182%2c491.148%2c1379.849C491.148%2c1387.516%2c491.148%2c1394.516%2c491.148%2c1398.016L491.148%2c1401.516' id='mermaid-0-L_LoadTest_Regression_0' class='edge-thickness-normal edge-pattern-solid edge-thickness-normal edge-pattern-solid flowchart-link' style='%3b' data-edge='true' data-et='edge' data-id='L_LoadTest_Regression_0' data-points='W3sieCI6NDkxLjE0ODQzNzUsInkiOjEzNTUuNTE1NjI1fSx7IngiOjQ5MS4xNDg0Mzc1LCJ5IjoxMzgwLjUxNTYyNX0seyJ4Ijo0OTEuMTQ4NDM3NSwieSI6MTQwNS41MTU2MjV9XQ==' data-look='classic' marker-end='url(%23mermaid-0_flowchart-v2-pointEnd)'/%3e%3c/g%3e%3cg class='edgeLabels'%3e%3cg class='edgeLabel'%3e%3cg class='label' data-id='L_Alert_Trace_0' transform='translate(0%2c 0)'%3e%3cforeignObject width='0' height='0'%3e%3cdiv xmlns='http://www.w3.org/1999/xhtml' class='labelBkg' style='display: table-cell%3b white-space: nowrap%3b line-height: 1.5%3b max-width: 200px%3b text-align: center%3b'%3e%3cspan class='edgeLabel'%3e%3c/span%3e%3c/div%3e%3c/foreignObject%3e%3c/g%3e%3c/g%3e%3cg class='edgeLabel'%3e%3cg class='label' data-id='L_Trace_Identify_0' transform='translate(0%2c 0)'%3e%3cforeignObject width='0' height='0'%3e%3cdiv xmlns='http://www.w3.org/1999/xhtml' class='labelBkg' style='display: table-cell%3b white-space: nowrap%3b line-height: 1.5%3b max-width: 200px%3b text-align: center%3b'%3e%3cspan class='edgeLabel'%3e%3c/span%3e%3c/div%3e%3c/foreignObject%3e%3c/g%3e%3c/g%3e%3cg class='edgeLabel'%3e%3cg class='label' data-id='L_Identify_DB_0' transform='translate(0%2c 0)'%3e%3cforeignObject width='0' height='0'%3e%3cdiv xmlns='http://www.w3.org/1999/xhtml' class='labelBkg' style='display: table-cell%3b white-space: nowrap%3b line-height: 1.5%3b max-width: 200px%3b text-align: center%3b'%3e%3cspan class='edgeLabel'%3e%3c/span%3e%3c/div%3e%3c/foreignObject%3e%3c/g%3e%3c/g%3e%3cg class='edgeLabel' transform='translate(109.8203125%2c 772.03125)'%3e%3cg class='label' data-id='L_DB_Explain_0' transform='translate(-13.0546875%2c -12)'%3e%3cforeignObject width='26.109375' height='24'%3e%3cdiv xmlns='http://www.w3.org/1999/xhtml' class='labelBkg' style='display: table-cell%3b white-space: nowrap%3b line-height: 1.5%3b max-width: 200px%3b text-align: center%3b'%3e%3cspan class='edgeLabel'%3e%3cp%3eYes%3c/p%3e%3c/span%3e%3c/div%3e%3c/foreignObject%3e%3c/g%3e%3c/g%3e%3cg class='edgeLabel' transform='translate(621.734375%2c 551.53125)'%3e%3cg class='label' data-id='L_DB_CPU_0' transform='translate(-10.2265625%2c -12)'%3e%3cforeignObject width='20.453125' height='24'%3e%3cdiv xmlns='http://www.w3.org/1999/xhtml' class='labelBkg' style='display: table-cell%3b white-space: nowrap%3b line-height: 1.5%3b max-width: 200px%3b text-align: center%3b'%3e%3cspan class='edgeLabel'%3e%3cp%3eNo%3c/p%3e%3c/span%3e%3c/div%3e%3c/foreignObject%3e%3c/g%3e%3c/g%3e%3cg class='edgeLabel' transform='translate(359.671875%2c 890.2734375)'%3e%3cg class='label' data-id='L_CPU_Profile_0' transform='translate(-13.0546875%2c -12)'%3e%3cforeignObject width='26.109375' height='24'%3e%3cdiv xmlns='http://www.w3.org/1999/xhtml' class='labelBkg' style='display: table-cell%3b white-space: nowrap%3b line-height: 1.5%3b max-width: 200px%3b text-align: center%3b'%3e%3cspan class='edgeLabel'%3e%3cp%3eYes%3c/p%3e%3c/span%3e%3c/div%3e%3c/foreignObject%3e%3c/g%3e%3c/g%3e%3cg class='edgeLabel' transform='translate(753.2109375%2c 772.03125)'%3e%3cg class='label' data-id='L_CPU_Memory_0' transform='translate(-10.2265625%2c -12)'%3e%3cforeignObject width='20.453125' height='24'%3e%3cdiv xmlns='http://www.w3.org/1999/xhtml' class='labelBkg' style='display: table-cell%3b white-space: nowrap%3b line-height: 1.5%3b max-width: 200px%3b text-align: center%3b'%3e%3cspan class='edgeLabel'%3e%3cp%3eNo%3c/p%3e%3c/span%3e%3c/div%3e%3c/foreignObject%3e%3c/g%3e%3c/g%3e%3cg class='edgeLabel' transform='translate(622.625%2c 1008.515625)'%3e%3cg class='label' data-id='L_Memory_Memray_0' transform='translate(-13.0546875%2c -12)'%3e%3cforeignObject width='26.109375' height='24'%3e%3cdiv xmlns='http://www.w3.org/1999/xhtml' class='labelBkg' style='display: table-cell%3b white-space: nowrap%3b line-height: 1.5%3b max-width: 200px%3b text-align: center%3b'%3e%3cspan class='edgeLabel'%3e%3cp%3eYes%3c/p%3e%3c/span%3e%3c/div%3e%3c/foreignObject%3e%3c/g%3e%3c/g%3e%3cg class='edgeLabel' transform='translate(883.796875%2c 1008.515625)'%3e%3cg class='label' data-id='L_Memory_IO_0' transform='translate(-10.2265625%2c -12)'%3e%3cforeignObject width='20.453125' height='24'%3e%3cdiv xmlns='http://www.w3.org/1999/xhtml' class='labelBkg' style='display: table-cell%3b white-space: nowrap%3b line-height: 1.5%3b max-width: 200px%3b text-align: center%3b'%3e%3cspan class='edgeLabel'%3e%3cp%3eNo%3c/p%3e%3c/span%3e%3c/div%3e%3c/foreignObject%3e%3c/g%3e%3c/g%3e%3cg class='edgeLabel'%3e%3cg class='label' data-id='L_Explain_Fix_0' transform='translate(0%2c 0)'%3e%3cforeignObject width='0' height='0'%3e%3cdiv xmlns='http://www.w3.org/1999/xhtml' class='labelBkg' style='display: table-cell%3b white-space: nowrap%3b line-height: 1.5%3b max-width: 200px%3b text-align: center%3b'%3e%3cspan class='edgeLabel'%3e%3c/span%3e%3c/div%3e%3c/foreignObject%3e%3c/g%3e%3c/g%3e%3cg class='edgeLabel'%3e%3cg class='label' data-id='L_Profile_Fix_0' transform='translate(0%2c 0)'%3e%3cforeignObject width='0' height='0'%3e%3cdiv xmlns='http://www.w3.org/1999/xhtml' class='labelBkg' style='display: table-cell%3b white-space: nowrap%3b line-height: 1.5%3b max-width: 200px%3b text-align: center%3b'%3e%3cspan class='edgeLabel'%3e%3c/span%3e%3c/div%3e%3c/foreignObject%3e%3c/g%3e%3c/g%3e%3cg class='edgeLabel'%3e%3cg class='label' data-id='L_Memray_Fix_0' transform='translate(0%2c 0)'%3e%3cforeignObject width='0' height='0'%3e%3cdiv xmlns='http://www.w3.org/1999/xhtml' class='labelBkg' style='display: table-cell%3b white-space: nowrap%3b line-height: 1.5%3b max-width: 200px%3b text-align: center%3b'%3e%3cspan class='edgeLabel'%3e%3c/span%3e%3c/div%3e%3c/foreignObject%3e%3c/g%3e%3c/g%3e%3cg class='edgeLabel'%3e%3cg class='label' data-id='L_IO_Fix_0' transform='translate(0%2c 0)'%3e%3cforeignObject width='0' height='0'%3e%3cdiv xmlns='http://www.w3.org/1999/xhtml' class='labelBkg' style='display: table-cell%3b white-space: nowrap%3b line-height: 1.5%3b max-width: 200px%3b text-align: center%3b'%3e%3cspan class='edgeLabel'%3e%3c/span%3e%3c/div%3e%3c/foreignObject%3e%3c/g%3e%3c/g%3e%3cg class='edgeLabel'%3e%3cg class='label' data-id='L_Fix_LoadTest_0' transform='translate(0%2c 0)'%3e%3cforeignObject width='0' height='0'%3e%3cdiv xmlns='http://www.w3.org/1999/xhtml' class='labelBkg' style='display: table-cell%3b white-space: nowrap%3b line-height: 1.5%3b max-width: 200px%3b text-align: center%3b'%3e%3cspan class='edgeLabel'%3e%3c/span%3e%3c/div%3e%3c/foreignObject%3e%3c/g%3e%3c/g%3e%3cg class='edgeLabel'%3e%3cg class='label' data-id='L_LoadTest_Regression_0' transform='translate(0%2c 0)'%3e%3cforeignObject width='0' height='0'%3e%3cdiv xmlns='http://www.w3.org/1999/xhtml' class='labelBkg' style='display: table-cell%3b white-space: nowrap%3b line-height: 1.5%3b max-width: 200px%3b text-align: center%3b'%3e%3cspan class='edgeLabel'%3e%3c/span%3e%3c/div%3e%3c/foreignObject%3e%3c/g%3e%3c/g%3e%3c/g%3e%3cg class='nodes'%3e%3cg class='node default' id='mermaid-0-flowchart-Alert-0' data-look='classic' transform='translate(496.80859375%2c 35)'%3e%3crect class='basic label-container' style='fill:%23ffebee !important%3bstroke:%23c62828 !important' x='-89.3671875' y='-27' width='178.734375' height='54'/%3e%3cg class='label' style='' transform='translate(-59.3671875%2c -12)'%3e%3crect/%3e%3cforeignObject width='118.734375' height='24'%3e%3cdiv xmlns='http://www.w3.org/1999/xhtml' style='display: table-cell%3b white-space: nowrap%3b line-height: 1.5%3b max-width: 200px%3b text-align: center%3b'%3e%3cspan class='nodeLabel'%3e%3cp%3eAlert: p99 %26gt%3b SLO%3c/p%3e%3c/span%3e%3c/div%3e%3c/foreignObject%3e%3c/g%3e%3c/g%3e%3cg class='node default' id='mermaid-0-flowchart-Trace-1' data-look='classic' transform='translate(496.80859375%2c 151)'%3e%3crect class='basic label-container' style='' x='-102.484375' y='-39' width='204.96875' height='78'/%3e%3cg class='label' style='' transform='translate(-72.484375%2c -24)'%3e%3crect/%3e%3cforeignObject width='144.96875' height='48'%3e%3cdiv xmlns='http://www.w3.org/1999/xhtml' style='display: table-cell%3b white-space: nowrap%3b line-height: 1.5%3b max-width: 200px%3b text-align: center%3b'%3e%3cspan class='nodeLabel'%3e%3cp%3ePull distributed trace%3cbr /%3e(OpenTelemetry)%3c/p%3e%3c/span%3e%3c/div%3e%3c/foreignObject%3e%3c/g%3e%3c/g%3e%3cg class='node default' id='mermaid-0-flowchart-Identify-3' data-look='classic' transform='translate(496.80859375%2c 267)'%3e%3crect class='basic label-container' style='' x='-93.59375' y='-27' width='187.1875' height='54'/%3e%3cg class='label' style='' transform='translate(-63.59375%2c -12)'%3e%3crect/%3e%3cforeignObject width='127.1875' height='24'%3e%3cdiv xmlns='http://www.w3.org/1999/xhtml' style='display: table-cell%3b white-space: nowrap%3b line-height: 1.5%3b max-width: 200px%3b text-align: center%3b'%3e%3cspan class='nodeLabel'%3e%3cp%3eIdentify slow span%3c/p%3e%3c/span%3e%3c/div%3e%3c/foreignObject%3e%3c/g%3e%3c/g%3e%3cg class='node default' id='mermaid-0-flowchart-DB-5' data-look='classic' transform='translate(496.80859375%2c 429.265625)'%3e%3cpolygon points='85.265625%2c0 170.53125%2c-85.265625 85.265625%2c-170.53125 0%2c-85.265625' class='label-container' transform='translate(-84.765625%2c 85.265625)'/%3e%3cg class='label' style='' transform='translate(-58.265625%2c -12)'%3e%3crect/%3e%3cforeignObject width='116.53125' height='24'%3e%3cdiv xmlns='http://www.w3.org/1999/xhtml' style='display: table-cell%3b white-space: nowrap%3b line-height: 1.5%3b max-width: 200px%3b text-align: center%3b'%3e%3cspan class='nodeLabel'%3e%3cp%3eDatabase span%3f%3c/p%3e%3c/span%3e%3c/div%3e%3c/foreignObject%3e%3c/g%3e%3c/g%3e%3cg class='node default' id='mermaid-0-flowchart-Explain-7' data-look='classic' transform='translate(109.8203125%2c 1084.515625)'%3e%3crect class='basic label-container' style='' x='-101.8203125' y='-39' width='203.640625' height='78'/%3e%3cg class='label' style='' transform='translate(-71.8203125%2c -24)'%3e%3crect/%3e%3cforeignObject width='143.640625' height='48'%3e%3cdiv xmlns='http://www.w3.org/1999/xhtml' style='display: table-cell%3b white-space: nowrap%3b line-height: 1.5%3b max-width: 200px%3b text-align: center%3b'%3e%3cspan class='nodeLabel'%3e%3cp%3eEXPLAIN ANALYZE%3cbr /%3eCheck indexes%2c N%2b1%3c/p%3e%3c/span%3e%3c/div%3e%3c/foreignObject%3e%3c/g%3e%3c/g%3e%3cg class='node default' id='mermaid-0-flowchart-CPU-9' data-look='classic' transform='translate(621.734375%2c 661.78125)'%3e%3cpolygon points='73.25%2c0 146.5%2c-73.25 73.25%2c-146.5 0%2c-73.25' class='label-container' transform='translate(-72.75%2c 73.25)'/%3e%3cg class='label' style='' transform='translate(-46.25%2c -12)'%3e%3crect/%3e%3cforeignObject width='92.5' height='24'%3e%3cdiv xmlns='http://www.w3.org/1999/xhtml' style='display: table-cell%3b white-space: nowrap%3b line-height: 1.5%3b max-width: 200px%3b text-align: center%3b'%3e%3cspan class='nodeLabel'%3e%3cp%3eCPU-bound%3f%3c/p%3e%3c/span%3e%3c/div%3e%3c/foreignObject%3e%3c/g%3e%3c/g%3e%3cg class='node default' id='mermaid-0-flowchart-Profile-11' data-look='classic' transform='translate(359.671875%2c 1084.515625)'%3e%3crect class='basic label-container' style='' x='-98.03125' y='-27' width='196.0625' height='54'/%3e%3cg class='label' style='' transform='translate(-68.03125%2c -12)'%3e%3crect/%3e%3cforeignObject width='136.0625' height='24'%3e%3cdiv xmlns='http://www.w3.org/1999/xhtml' style='display: table-cell%3b white-space: nowrap%3b line-height: 1.5%3b max-width: 200px%3b text-align: center%3b'%3e%3cspan class='nodeLabel'%3e%3cp%3epy-spy flame graph%3c/p%3e%3c/span%3e%3c/div%3e%3c/foreignObject%3e%3c/g%3e%3c/g%3e%3cg class='node default' id='mermaid-0-flowchart-Memory-13' data-look='classic' transform='translate(753.2109375%2c 890.2734375)'%3e%3cpolygon points='81.2421875%2c0 162.484375%2c-81.2421875 81.2421875%2c-162.484375 0%2c-81.2421875' class='label-container' transform='translate(-80.7421875%2c 81.2421875)'/%3e%3cg class='label' style='' transform='translate(-54.2421875%2c -12)'%3e%3crect/%3e%3cforeignObject width='108.484375' height='24'%3e%3cdiv xmlns='http://www.w3.org/1999/xhtml' style='display: table-cell%3b white-space: nowrap%3b line-height: 1.5%3b max-width: 200px%3b text-align: center%3b'%3e%3cspan class='nodeLabel'%3e%3cp%3eMemory issue%3f%3c/p%3e%3c/span%3e%3c/div%3e%3c/foreignObject%3e%3c/g%3e%3c/g%3e%3cg class='node default' id='mermaid-0-flowchart-Memray-15' data-look='classic' transform='translate(622.625%2c 1084.515625)'%3e%3crect class='basic label-container' style='' x='-114.921875' y='-27' width='229.84375' height='54'/%3e%3cg class='label' style='' transform='translate(-84.921875%2c -12)'%3e%3crect/%3e%3cforeignObject width='169.84375' height='24'%3e%3cdiv xmlns='http://www.w3.org/1999/xhtml' style='display: table-cell%3b white-space: nowrap%3b line-height: 1.5%3b max-width: 200px%3b text-align: center%3b'%3e%3cspan class='nodeLabel'%3e%3cp%3ememray allocation trace%3c/p%3e%3c/span%3e%3c/div%3e%3c/foreignObject%3e%3c/g%3e%3c/g%3e%3cg class='node default' id='mermaid-0-flowchart-IO-17' data-look='classic' transform='translate(883.796875%2c 1084.515625)'%3e%3crect class='basic label-container' style='' x='-96.25' y='-39' width='192.5' height='78'/%3e%3cg class='label' style='' transform='translate(-66.25%2c -24)'%3e%3crect/%3e%3cforeignObject width='132.5' height='48'%3e%3cdiv xmlns='http://www.w3.org/1999/xhtml' style='display: table-cell%3b white-space: nowrap%3b line-height: 1.5%3b max-width: 200px%3b text-align: center%3b'%3e%3cspan class='nodeLabel'%3e%3cp%3eCheck external I/O%3cbr /%3e(httpx%2c Redis%2c S3)%3c/p%3e%3c/span%3e%3c/div%3e%3c/foreignObject%3e%3c/g%3e%3c/g%3e%3cg class='node default' id='mermaid-0-flowchart-Fix-19' data-look='classic' transform='translate(491.1484375%2c 1200.515625)'%3e%3crect class='basic label-container' style='fill:%23e8f5e9 !important%3bstroke:%232e7d32 !important' x='-60.234375' y='-27' width='120.46875' height='54'/%3e%3cg class='label' style='' transform='translate(-30.234375%2c -12)'%3e%3crect/%3e%3cforeignObject width='60.46875' height='24'%3e%3cdiv xmlns='http://www.w3.org/1999/xhtml' style='display: table-cell%3b white-space: nowrap%3b line-height: 1.5%3b max-width: 200px%3b text-align: center%3b'%3e%3cspan class='nodeLabel'%3e%3cp%3eApply fix%3c/p%3e%3c/span%3e%3c/div%3e%3c/foreignObject%3e%3c/g%3e%3c/g%3e%3cg class='node default' id='mermaid-0-flowchart-LoadTest-27' data-look='classic' transform='translate(491.1484375%2c 1316.515625)'%3e%3crect class='basic label-container' style='fill:%23e3f2fd !important%3bstroke:%231565c0 !important' x='-97.1484375' y='-39' width='194.296875' height='78'/%3e%3cg class='label' style='' transform='translate(-67.1484375%2c -24)'%3e%3crect/%3e%3cforeignObject width='134.296875' height='48'%3e%3cdiv xmlns='http://www.w3.org/1999/xhtml' style='display: table-cell%3b white-space: nowrap%3b line-height: 1.5%3b max-width: 200px%3b text-align: center%3b'%3e%3cspan class='nodeLabel'%3e%3cp%3eVerify with locust%3cbr /%3eunder realistic load%3c/p%3e%3c/span%3e%3c/div%3e%3c/foreignObject%3e%3c/g%3e%3c/g%3e%3cg class='node default' id='mermaid-0-flowchart-Regression-29' data-look='classic' transform='translate(491.1484375%2c 1444.515625)'%3e%3crect class='basic label-container' style='' x='-106.9375' y='-39' width='213.875' height='78'/%3e%3cg class='label' style='' transform='translate(-76.9375%2c -24)'%3e%3crect/%3e%3cforeignObject width='153.875' height='48'%3e%3cdiv xmlns='http://www.w3.org/1999/xhtml' style='display: table-cell%3b white-space: nowrap%3b line-height: 1.5%3b max-width: 200px%3b text-align: center%3b'%3e%3cspan class='nodeLabel'%3e%3cp%3eAdd to CI%3cbr /%3eperformance baseline%3c/p%3e%3c/span%3e%3c/div%3e%3c/foreignObject%3e%3c/g%3e%3c/g%3e%3c/g%3e%3c/g%3e%3c/g%3e%3cdefs%3e%3cfilter id='mermaid-0-drop-shadow' height='130%25' width='130%25'%3e%3cfeDropShadow dx='4' dy='4' stdDeviation='0' flood-opacity='0.06' flood-color='black'/%3e%3c/filter%3e%3c/defs%3e%3cdefs%3e%3cfilter id='mermaid-0-drop-shadow-small' height='150%25' width='150%25'%3e%3cfeDropShadow dx='2' dy='2' stdDeviation='0' flood-opacity='0.06' flood-color='black'/%3e%3c/filter%3e%3c/defs%3e%3clinearGradient id='mermaid-0-gradient' gradientUnits='objectBoundingBox' x1='0%25' y1='0%25' x2='100%25' y2='0%25'%3e%3cstop offset='0%25' stop-color='hsl(0%2c 0%25%2c 83.3333333333%25)' stop-opacity='1'/%3e%3cstop offset='100%25' stop-color='hsl(0%2c 0%25%2c 88.9215686275%25)' stop-opacity='1'/%3e%3c/linearGradient%3e%3c/svg%3e)
Profiling in Production
Development profiling lies to you. Your dev database has 50 rows. Production has 50,000. Your dev machine has no memory pressure. Production shares resources with 200 tenants. Profile where it matters.
CPU Profiling with py-spy
py-spy attaches to a running Python process with zero code changes and near-zero overhead. It samples the call stack and produces flame graphs that show exactly where CPU time is spent.
# Attach to running process — no restart, no code changespy-spy record -o flamegraph.svg --pid $(pgrep -f uvicorn)
# Profile for 30 seconds during peak trafficpy-spy record -o flamegraph.svg --pid $(pgrep -f uvicorn) --duration 30
# Top-like live view for quick triagepy-spy top --pid $(pgrep -f uvicorn)Memory Profiling with memray
memray tracks every allocation and produces a timeline showing where memory grows. It catches leaks that only manifest after hours of production traffic.
# Record allocations for the processmemray run -o output.bin your_script.py
# For a running server, use the live trackermemray run --live your_script.py
# Generate a flame graph of allocationsmemray flamegraph output.bin -o memory_flamegraph.html
# Programmatic tracking for specific code pathsimport memray
async def suspect_endpoint(request: Request) -> Response: with memray.Tracker("suspect_endpoint.bin"): # This block's allocations are recorded result = await heavy_computation() return JSONResponse(result)Automatic N+1 Detection
N+1 queries are the single most common performance problem in ORM-backed applications. They are invisible during development because small datasets mask the linear growth. A query that runs once to fetch 10 orders, then 10 more times to fetch each order’s items, looks fine. The same pattern with 1,000 orders runs 1,001 queries.
SQLAlchemy Event Listener
This listener counts queries per request and logs a warning when the count exceeds a threshold. In development, it raises an exception. In production, it emits a metric.
from contextvars import ContextVarfrom typing import Any
from sqlalchemy import eventfrom sqlalchemy.engine import Connection, Enginefrom sqlalchemy.orm import Session
import structlog
logger = structlog.get_logger()
_query_count: ContextVar[int] = ContextVar("query_count", default=0)_query_threshold: int = 10

def reset_query_count() -> None:    """Reset at the start of each request."""    _query_count.set(0)

def get_query_count() -> int:    """Return current query count for the request."""    return _query_count.get()

def register_query_counter(engine: Engine) -> None:    """Register event listener that counts queries per request."""
    @event.listens_for(engine, "before_cursor_execute")    def _count_query(        conn: Connection,        cursor: Any,        statement: str,        parameters: Any,        context: Any,        executemany: bool,    ) -> None:        current = _query_count.get()        _query_count.set(current + 1)
        if current + 1 > _query_threshold:            logger.warning(                "high_query_count",                query_number=current + 1,                threshold=_query_threshold,                statement=statement[:200],            )
Request-Level Query Counting Middleware
Wire the counter into the request lifecycle. Every request starts at zero, and the response includes the query count as a header in development.
from starlette.middleware.base import BaseHTTPMiddleware, RequestResponseEndpointfrom starlette.requests import Requestfrom starlette.responses import Response
from src.core.config import settingsfrom src.db.query_counter import get_query_count, reset_query_count

class QueryCountMiddleware(BaseHTTPMiddleware):    """Track and expose query counts per request."""
    async def dispatch(        self, request: Request, call_next: RequestResponseEndpoint    ) -> Response:        reset_query_count()        response = await call_next(request)        count = get_query_count()
        if settings.debug:            response.headers["X-Query-Count"] = str(count)
        if count > 20:            # Emit metric for monitoring dashboards            from src.metrics import high_query_count_total            high_query_count_total.labels(                endpoint=request.url.path,                method=request.method,            ).inc()
return responseEager Loading Strategies
SQLAlchemy provides three eager loading strategies. Choosing the wrong one is almost as bad as lazy loading.
| Strategy | SQL Generated | Best For | Watch Out |
|---|---|---|---|
| joinedload | Single query with LEFT JOIN | One-to-one, small one-to-many | Cartesian explosion with large collections or multiple joins |
| selectinload | Separate SELECT ... WHERE id IN (...) | One-to-many, many-to-many | Two queries instead of one, but avoids row multiplication |
| subqueryload | Subquery in WHERE clause | Deep nesting where selectin hits limits | Complex SQL, harder to debug, can be slower than selectin |
from sqlalchemy import selectfrom sqlalchemy.orm import selectinload, joinedloadfrom sqlalchemy.ext.asyncio import AsyncSession
from src.models.book import Bookfrom src.models.author import Author

class CatalogRepository:    """Repository with explicit eager loading strategies."""
    def __init__(self, session: AsyncSession) -> None:        self._session = session
    async def list_books_with_authors(        self,        tenant_id: UUID,        limit: int = 50,        offset: int = 0,    ) -> list[Book]:        """Fetch books with authors in exactly 2 queries.
        Uses selectinload to avoid the cartesian explosion        that joinedload would cause with 50K books.        """        stmt = (            select(Book)            .options(selectinload(Book.author))            .where(Book.tenant_id == tenant_id)            .order_by(Book.title)            .limit(limit)            .offset(offset)        )        result = await self._session.execute(stmt)        return list(result.scalars().all())
    async def get_book_with_full_details(        self, book_id: UUID    ) -> Book | None:        """Single book with all relations — joinedload is fine here.
        One book = one author = one publisher. No cartesian risk.        """        stmt = (            select(Book)            .options(                joinedload(Book.author),                joinedload(Book.publisher),            )            .where(Book.id == book_id)        )        result = await self._session.execute(stmt)        return result.scalar_one_or_none()
Database Query Optimization
Index Strategy for Multi-Tenant Queries
Every query in ShelfWise filters by tenant_id. Without a composite index, PostgreSQL scans the full table and then filters. With a composite index, it jumps directly to the tenant’s rows.
-- Composite index: tenant_id first (equality), then sort columnCREATE INDEX ix_books_tenant_title    ON books (tenant_id, title);
-- Partial index for active orders only (most queries filter by status)CREATE INDEX ix_orders_tenant_active    ON orders (tenant_id, created_at DESC)    WHERE status NOT IN ('cancelled', 'archived');
-- Covering index: includes columns needed by the query-- PostgreSQL can answer the query from the index alone (index-only scan)CREATE INDEX ix_books_tenant_title_covering    ON books (tenant_id, title)    INCLUDE (id, isbn, price);
EXPLAIN ANALYZE
Never guess at query performance. EXPLAIN ANALYZE shows what PostgreSQL actually does.
EXPLAIN (ANALYZE, BUFFERS, FORMAT TEXT)SELECT id, title, priceFROM booksWHERE tenant_id = '550e8400-e29b-41d4-a716-446655440000'ORDER BY titleLIMIT 50;
-- Look for:-- Index Scan (good) vs Seq Scan (bad on large tables)-- Rows Removed by Filter (high = missing index)-- Sort Method: external merge (high = needs more work_mem)-- Buffers: shared hit vs shared read (hit = cached, read = disk)Response Serialization: orjson
Python’s built-in json module is slow. Pydantic’s default JSON serialization is better but still not optimal for high-throughput endpoints. orjson is a Rust-backed JSON library that is 4-10x faster.
import orjsonfrom fastapi.responses import ORJSONResponse

class ShelfWiseResponse(ORJSONResponse):    """Default response class using orjson for serialization.
orjson natively handles: - UUID (no str() conversion needed) - datetime (ISO 8601, no isoformat() call) - Decimal (as JSON number, not string) - dataclasses (no dict() conversion) """ media_type = "application/json"from fastapi import FastAPIfrom src.core.serialization import ShelfWiseResponse
app = FastAPI(default_response_class=ShelfWiseResponse)Combine with Pydantic’s model configuration for maximum serialization performance:
from pydantic import BaseModel, ConfigDict

class BookResponse(BaseModel):    """Response model optimized for fast serialization."""    model_config = ConfigDict(        frozen=True,        from_attributes=True,  # Direct ORM → Pydantic without dict()        ser_json_bytes="base64",        ser_json_timedelta="float",    )
    id: UUID    title: str    price: Decimal    author_name: str
Connection Reuse for External APIs
ShelfWise integrates with payment providers, shipping APIs, and ISBN lookup services. Creating a new TCP connection per request adds 50-200ms of latency.
from contextlib import asynccontextmanagerfrom collections.abc import AsyncIterator
import httpx

@asynccontextmanagerasync def managed_http_client() -> AsyncIterator[httpx.AsyncClient]:    """Shared HTTP client with connection pooling.
    Reuses TCP connections across requests.    Limits concurrent connections to prevent exhaustion.    """    async with httpx.AsyncClient(        timeout=httpx.Timeout(10.0, connect=5.0),        limits=httpx.Limits(            max_connections=100,            max_keepalive_connections=20,            keepalive_expiry=30.0,        ),        http2=True,  # Multiplexing over single connection    ) as client:        yield client
Load Testing with Locust
Unit tests verify correctness. Load tests verify that correctness holds under pressure. Locust simulates realistic multi-tenant traffic patterns.
import randomfrom uuid import uuid4
from locust import HttpUser, between, task
# Simulate 5 tenants with different catalog sizesTENANTS = [    {"id": str(uuid4()), "token": "jwt_tenant_a", "catalog_size": 500},    {"id": str(uuid4()), "token": "jwt_tenant_b", "catalog_size": 5_000},    {"id": str(uuid4()), "token": "jwt_tenant_c", "catalog_size": 50_000},    {"id": str(uuid4()), "token": "jwt_tenant_d", "catalog_size": 100},    {"id": str(uuid4()), "token": "jwt_tenant_e", "catalog_size": 10_000},]

class ShelfWiseUser(HttpUser):    """Simulates a tenant user browsing the catalog and placing orders."""
    wait_time = between(0.5, 2.0)
    def on_start(self) -> None:        self.tenant = random.choice(TENANTS)        self.client.headers.update({            "Authorization": f"Bearer {self.tenant['token']}",        })
    @task(10)    def browse_catalog(self) -> None:        """Most common operation: paginated catalog browse."""        page = random.randint(1, 10)        self.client.get(f"/api/v2/books?page={page}&limit=50")
    @task(5)    def view_book(self) -> None:        """View a single book's details."""        book_id = str(uuid4())  # Use seeded IDs in real tests        self.client.get(f"/api/v2/books/{book_id}")
    @task(2)    def search_catalog(self) -> None:        """Full-text search — expensive operation."""        queries = ["python", "machine learning", "distributed", "design"]        self.client.get(f"/api/v2/books/search?q={random.choice(queries)}")
    @task(1)    def place_order(self) -> None:        """Least common but most expensive operation."""        self.client.post(            "/api/v2/orders",            json={                "items": [                    {"book_id": str(uuid4()), "quantity": random.randint(1, 3)}                    for _ in range(random.randint(1, 5))                ],            },        )
Load Test Scenarios
Run multiple scenarios that match real traffic patterns:
# Normal traffic: 50 concurrent userslocust -f tests/load/locustfile.py --headless \    -u 50 -r 5 --run-time 5m \    --host http://staging.shelfwise.io
# Peak traffic (3x normal): 150 concurrent userslocust -f tests/load/locustfile.py --headless \    -u 150 -r 15 --run-time 10m \    --host http://staging.shelfwise.io
# Tenant onboarding spike: bulk import during normal trafficlocust -f tests/load/locustfile.py -f tests/load/bulk_import.py \    --headless -u 50 -r 10 --run-time 15m \    --host http://staging.shelfwise.io
Performance Regression CI
Load tests are useless if you only run them before launches. Integrate p99 latency comparison into CI so regressions are caught before merge.
import jsonimport statisticsfrom pathlib import Path
import pytest

@pytest.fixturedef baseline() -> dict[str, float]:    """Load baseline p99 latencies from previous successful run."""    baseline_path = Path("tests/performance/baseline.json")    return json.loads(baseline_path.read_text())

@pytest.fixturedef current_results() -> dict[str, float]:    """Load current run results from locust stats."""    results_path = Path("tests/performance/current_stats.json")    return json.loads(results_path.read_text())

REGRESSION_THRESHOLD = 1.2  # 20% regression is actionable

def test_catalog_p99_no_regression(    baseline: dict[str, float],    current_results: dict[str, float],) -> None:    """Catalog endpoint p99 must not regress more than 20%."""    baseline_p99 = baseline["GET /api/v2/books"]["p99"]    current_p99 = current_results["GET /api/v2/books"]["p99"]
    assert current_p99 < baseline_p99 * REGRESSION_THRESHOLD, (        f"p99 regression: {baseline_p99:.0f}ms → {current_p99:.0f}ms "        f"({current_p99 / baseline_p99:.1%} of baseline)"    )
The ShelfWise Performance Story
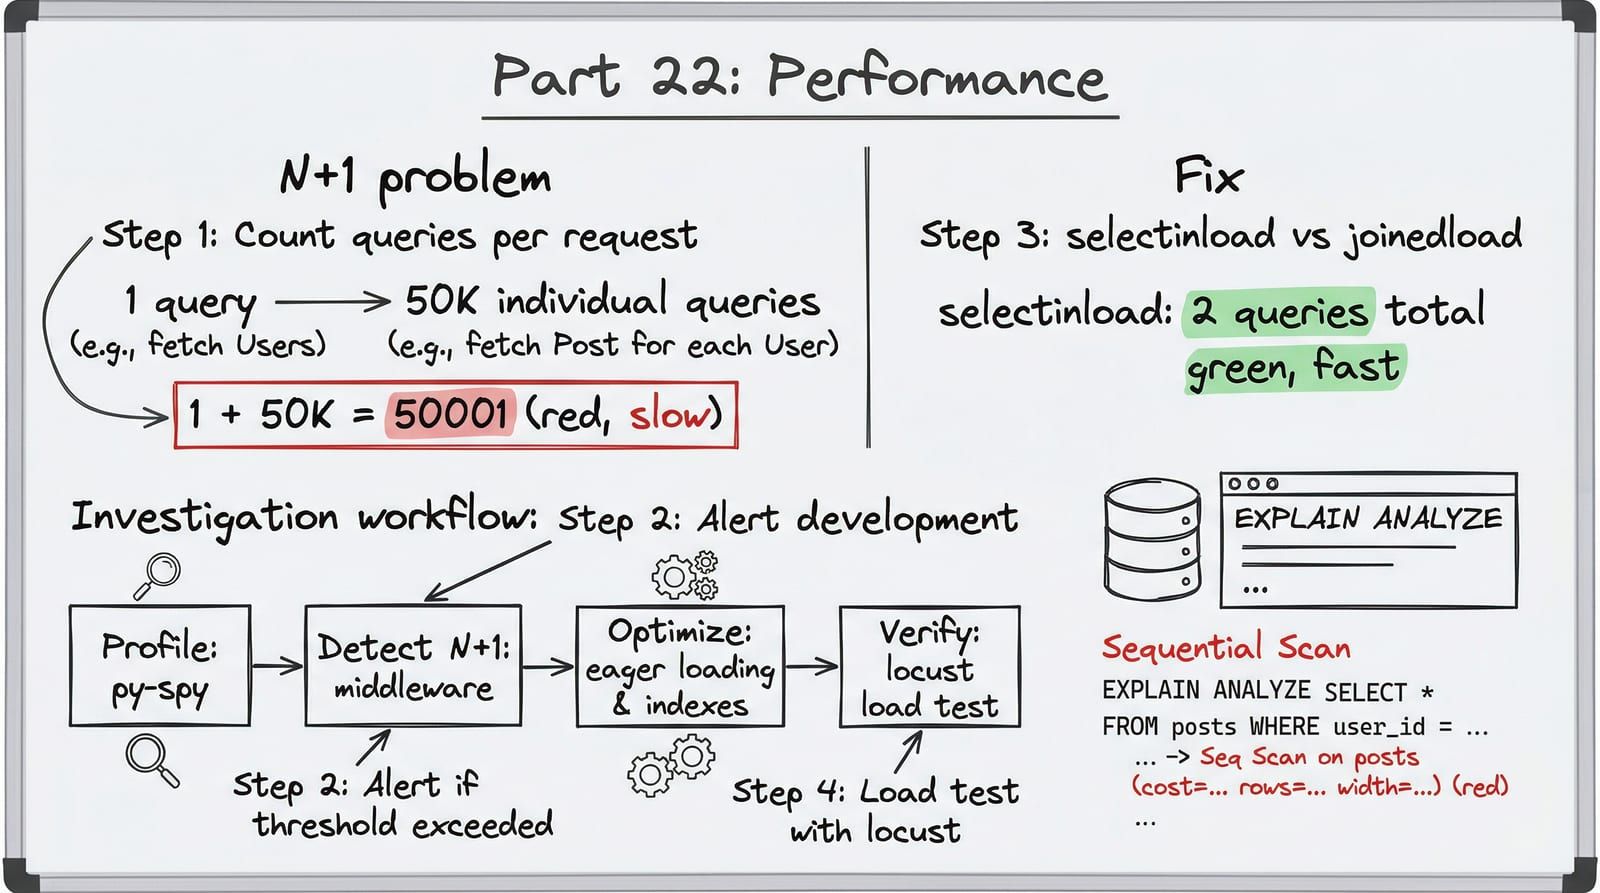
Here is the real scenario. The catalog endpoint has been running fine for months. Then a distributor tenant onboards with 50,000 books. Their first catalog request takes 2 seconds. By the time they paginate to page 10, the response time is 5 seconds. Their integration team opens a P1 ticket.
Investigation:
- Pull the distributed trace from OpenTelemetry. The database span is 1.8 seconds out of a 2-second response.
- Check the query counter. The request executed 50,001 queries — one for the book list, one per book to load the author relationship.
- Run
EXPLAIN ANALYZEon the catalog query. Sequential scan on the books table. No index on(tenant_id, title). - Profile JSON serialization with py-spy. The
json.dumps()call takes 200ms for 50,000 books — Python’s json module is the bottleneck after the database.
Fixes applied:
# Fix 1: selectinload eliminates N+1# Before: 50,001 queries (lazy loading)# After: 2 queries (one for books, one for authors)stmt = (    select(Book)    .options(selectinload(Book.author))    .where(Book.tenant_id == tenant_id)    .order_by(Book.title)    .limit(50)    .offset(offset))
# Fix 2: composite index eliminates sequential scan# Before: Seq Scan on books (cost=0.00..18234.00 rows=50000)# After: Index Scan using ix_books_tenant_title (cost=0.42..156.00 rows=50)# SQL: CREATE INDEX ix_books_tenant_title ON books (tenant_id, title);
# Fix 3: orjson eliminates serialization bottleneck# Before: json.dumps() — 200ms for 50K books# After: orjson.dumps() — 48ms for 50K booksapp = FastAPI(default_response_class=ORJSONResponse)
Results:
| Metric | Before | After | Improvement |
|---|---|---|---|
| Queries per request | 50,001 | 2 | 25,000x |
| Database time | 1,800ms | 18ms | 100x |
| Serialization time | 200ms | 48ms | 4x |
| Total response time | 2,100ms | 80ms | 26x |
The critical lesson: all three problems were invisible at development scale. 50 books, 50 queries, 2ms serialization — everything looked fine. The query counter, composite index, and orjson were not premature optimization. They were the baseline configuration that should have been in place from day one.
Key Takeaways
- Profile in production, not development.
py-spyfor CPU (zero overhead, no code changes),memrayfor memory leaks. Development datasets lie about performance characteristics. - Count queries per request automatically. A SQLAlchemy event listener that increments a
ContextVarcounter catches N+1 queries before they reach production. Set the threshold at 10, alert at 20, page at 50. - Choose eager loading deliberately.
selectinloadfor one-to-many (avoids cartesian explosion),joinedloadfor one-to-one or single-entity fetches. Never rely on lazy loading in production code. - Index for your actual query patterns. Multi-tenant queries always filter by
tenant_id. Puttenant_idfirst in composite indexes. Use partial indexes for status-filtered queries. Use covering indexes for index-only scans. - Serialize with orjson. It is 4-10x faster than stdlib
jsonand natively handles UUIDs, datetimes, and Decimals. The migration is a one-line change to your FastAPI app. - Load test with realistic tenant distributions. One tenant with 100 books and one with 50,000 expose different bottlenecks than uniform test data. Simulate your actual tenant mix.
- Gate merges on p99 regression. Compare current performance against a baseline in CI. A 20% regression threshold catches real problems without blocking normal variance.
You can profile, detect, and fix performance problems. You can prove your fixes hold under load. But none of this matters if the code never leaves your laptop. In the next post — the final post — we take ShelfWise from git init to production traffic, assembling every pattern from this series into a deployed, monitored, incident-ready system.