Theory without deployment is fiction. A clean architecture on your laptop is a hypothesis. A clean architecture handling real money in production is engineering.
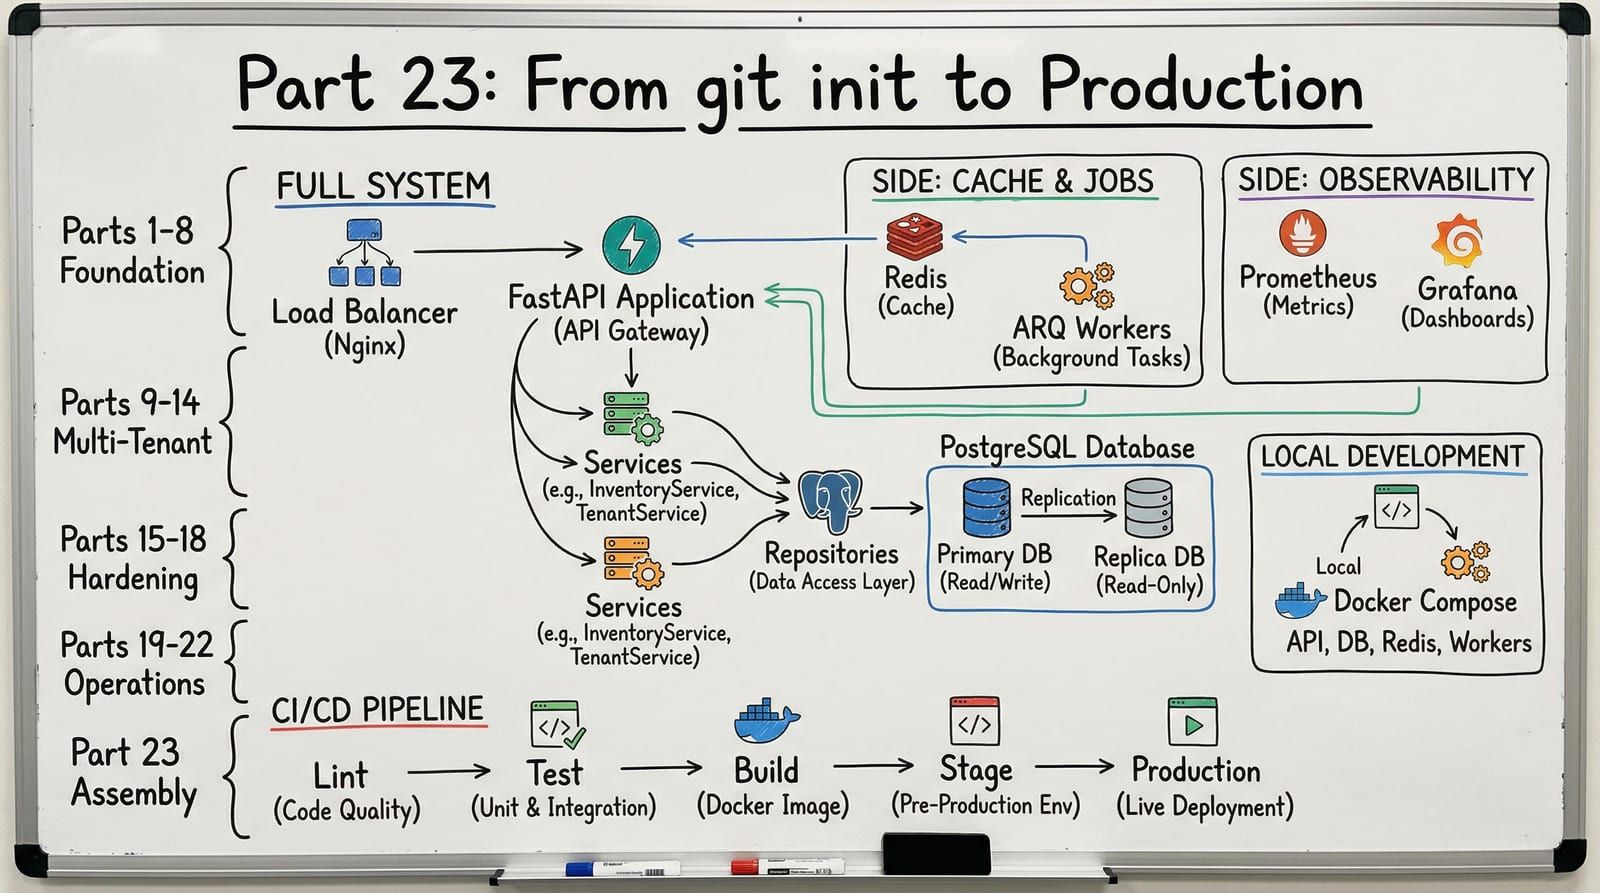
This is the final post. Over the previous 22 parts, we built ShelfWise from a single main.py into a multi-tenant B2B SaaS with structured error handling, automatic tenant isolation, connection pooling, observability, caching, background tasks, rate limiting, API versioning, and performance optimization. Every pattern was designed in isolation, tested in isolation, explained in isolation.
Now we assemble them. This post is about the gaps that only appear when everything runs together: the Dockerfile that works on your machine but OOMs in CI, the migration that passes tests but deadlocks in production, the monitoring dashboard you forgot to build until the first incident.
The Complete ShelfWise Architecture
%3b%7d%23mermaid-0 .cluster rect%7bfill:hsl(0%2c 0%25%2c 98.9215686275%25)%3bstroke:%23707070%3bstroke-width:1px%3b%7d%23mermaid-0 .cluster text%7bfill:%23333%3b%7d%23mermaid-0 .cluster span%7bcolor:%23333%3b%7d%23mermaid-0 div.mermaidTooltip%7bposition:absolute%3btext-align:center%3bmax-width:200px%3bpadding:2px%3bfont-family:arial%2csans-serif%3bfont-size:12px%3bbackground:hsl(-160%2c 0%25%2c 93.3333333333%25)%3bborder:1px solid %23707070%3bborder-radius:2px%3bpointer-events:none%3bz-index:100%3b%7d%23mermaid-0 .flowchartTitleText%7btext-anchor:middle%3bfont-size:18px%3bfill:black%3b%7d%23mermaid-0 rect.text%7bfill:none%3bstroke-width:0%3b%7d%23mermaid-0 .icon-shape%2c%23mermaid-0 .image-shape%7bbackground-color:white%3btext-align:center%3b%7d%23mermaid-0 .icon-shape p%2c%23mermaid-0 .image-shape p%7bbackground-color:white%3bpadding:2px%3b%7d%23mermaid-0 .icon-shape .label rect%2c%23mermaid-0 .image-shape .label rect%7bopacity:0.5%3bbackground-color:white%3bfill:white%3b%7d%23mermaid-0 .label-icon%7bdisplay:inline-block%3bheight:1em%3boverflow:visible%3bvertical-align:-0.125em%3b%7d%23mermaid-0 .node .label-icon path%7bfill:currentColor%3bstroke:revert%3bstroke-width:revert%3b%7d%23mermaid-0 .node .neo-node%7bstroke:%23999%3b%7d%23mermaid-0 %5bdata-look='neo'%5d.node rect%2c%23mermaid-0 %5bdata-look='neo'%5d.cluster rect%2c%23mermaid-0 %5bdata-look='neo'%5d.node polygon%7bstroke:url(%23mermaid-0-gradient)%3bfilter:drop-shadow( 1px 2px 2px rgba(185%2c185%2c185%2c1))%3b%7d%23mermaid-0 %5bdata-look='neo'%5d.node path%7bstroke:url(%23mermaid-0-gradient)%3bstroke-width:1px%3b%7d%23mermaid-0 %5bdata-look='neo'%5d.node .outer-path%7bfilter:drop-shadow( 1px 2px 2px rgba(185%2c185%2c185%2c1))%3b%7d%23mermaid-0 %5bdata-look='neo'%5d.node .neo-line path%7bstroke:%23999%3bfilter:none%3b%7d%23mermaid-0 %5bdata-look='neo'%5d.node circle%7bstroke:url(%23mermaid-0-gradient)%3bfilter:drop-shadow( 1px 2px 2px rgba(185%2c185%2c185%2c1))%3b%7d%23mermaid-0 %5bdata-look='neo'%5d.node circle .state-start%7bfill:black%3b%7d%23mermaid-0 %5bdata-look='neo'%5d.icon-shape .icon%7bfill:url(%23mermaid-0-gradient)%3bfilter:drop-shadow( 1px 2px 2px rgba(185%2c185%2c185%2c1))%3b%7d%23mermaid-0 %5bdata-look='neo'%5d.icon-shape .icon-neo path%7bstroke:url(%23mermaid-0-gradient)%3bfilter:drop-shadow( 1px 2px 2px rgba(185%2c185%2c185%2c1))%3b%7d%23mermaid-0 :root%7b--mermaid-font-family:arial%2csans-serif%3b%7d%3c/style%3e%3cg%3e%3cmarker id='mermaid-0_flowchart-v2-pointEnd' class='marker flowchart-v2' viewBox='0 0 10 10' refX='5' refY='5' markerUnits='userSpaceOnUse' markerWidth='8' markerHeight='8' orient='auto'%3e%3cpath d='M 0 0 L 10 5 L 0 10 z' class='arrowMarkerPath' style='stroke-width: 1%3b stroke-dasharray: 1%2c 0%3b'/%3e%3c/marker%3e%3cmarker id='mermaid-0_flowchart-v2-pointStart' class='marker flowchart-v2' viewBox='0 0 10 10' refX='4.5' refY='5' markerUnits='userSpaceOnUse' markerWidth='8' markerHeight='8' orient='auto'%3e%3cpath d='M 0 5 L 10 10 L 10 0 z' class='arrowMarkerPath' style='stroke-width: 1%3b stroke-dasharray: 1%2c 0%3b'/%3e%3c/marker%3e%3cmarker id='mermaid-0_flowchart-v2-pointEnd-margin' class='marker flowchart-v2' viewBox='0 0 11.5 14' refX='11.5' refY='7' markerUnits='userSpaceOnUse' markerWidth='10.5' markerHeight='14' orient='auto'%3e%3cpath d='M 0 0 L 11.5 7 L 0 14 z' class='arrowMarkerPath' style='stroke-width: 0%3b stroke-dasharray: 1%2c 0%3b'/%3e%3c/marker%3e%3cmarker id='mermaid-0_flowchart-v2-pointStart-margin' class='marker flowchart-v2' viewBox='0 0 11.5 14' refX='1' refY='7' markerUnits='userSpaceOnUse' markerWidth='11.5' markerHeight='14' orient='auto'%3e%3cpolygon points='0%2c7 11.5%2c14 11.5%2c0' class='arrowMarkerPath' style='stroke-width: 0%3b stroke-dasharray: 1%2c 0%3b'/%3e%3c/marker%3e%3cmarker id='mermaid-0_flowchart-v2-circleEnd' class='marker flowchart-v2' viewBox='0 0 10 10' refX='11' refY='5' markerUnits='userSpaceOnUse' markerWidth='11' markerHeight='11' orient='auto'%3e%3ccircle cx='5' cy='5' r='5' class='arrowMarkerPath' style='stroke-width: 1%3b stroke-dasharray: 1%2c 0%3b'/%3e%3c/marker%3e%3cmarker id='mermaid-0_flowchart-v2-circleStart' class='marker flowchart-v2' viewBox='0 0 10 10' refX='-1' refY='5' markerUnits='userSpaceOnUse' markerWidth='11' markerHeight='11' orient='auto'%3e%3ccircle cx='5' cy='5' r='5' class='arrowMarkerPath' style='stroke-width: 1%3b stroke-dasharray: 1%2c 0%3b'/%3e%3c/marker%3e%3cmarker id='mermaid-0_flowchart-v2-circleEnd-margin' class='marker flowchart-v2' viewBox='0 0 10 10' refY='5' refX='12.25' markerUnits='userSpaceOnUse' markerWidth='14' markerHeight='14' orient='auto'%3e%3ccircle cx='5' cy='5' r='5' class='arrowMarkerPath' style='stroke-width: 0%3b stroke-dasharray: 1%2c 0%3b'/%3e%3c/marker%3e%3cmarker id='mermaid-0_flowchart-v2-circleStart-margin' class='marker flowchart-v2' viewBox='0 0 10 10' refX='-2' refY='5' markerUnits='userSpaceOnUse' markerWidth='14' markerHeight='14' orient='auto'%3e%3ccircle cx='5' cy='5' r='5' class='arrowMarkerPath' style='stroke-width: 0%3b stroke-dasharray: 1%2c 0%3b'/%3e%3c/marker%3e%3cmarker id='mermaid-0_flowchart-v2-crossEnd' class='marker cross flowchart-v2' viewBox='0 0 11 11' refX='12' refY='5.2' markerUnits='userSpaceOnUse' markerWidth='11' markerHeight='11' orient='auto'%3e%3cpath d='M 1%2c1 l 9%2c9 M 10%2c1 l -9%2c9' class='arrowMarkerPath' style='stroke-width: 2%3b stroke-dasharray: 1%2c 0%3b'/%3e%3c/marker%3e%3cmarker id='mermaid-0_flowchart-v2-crossStart' class='marker cross flowchart-v2' viewBox='0 0 11 11' refX='-1' refY='5.2' markerUnits='userSpaceOnUse' markerWidth='11' markerHeight='11' orient='auto'%3e%3cpath d='M 1%2c1 l 9%2c9 M 10%2c1 l -9%2c9' class='arrowMarkerPath' style='stroke-width: 2%3b stroke-dasharray: 1%2c 0%3b'/%3e%3c/marker%3e%3cmarker id='mermaid-0_flowchart-v2-crossEnd-margin' class='marker cross flowchart-v2' viewBox='0 0 15 15' refX='17.7' refY='7.5' markerUnits='userSpaceOnUse' markerWidth='12' markerHeight='12' orient='auto'%3e%3cpath d='M 1%2c1 L 14%2c14 M 1%2c14 L 14%2c1' class='arrowMarkerPath' style='stroke-width: 2.5%3b'/%3e%3c/marker%3e%3cmarker id='mermaid-0_flowchart-v2-crossStart-margin' class='marker cross flowchart-v2' viewBox='0 0 15 15' refX='-3.5' refY='7.5' markerUnits='userSpaceOnUse' markerWidth='12' markerHeight='12' orient='auto'%3e%3cpath d='M 1%2c1 L 14%2c14 M 1%2c14 L 14%2c1' class='arrowMarkerPath' style='stroke-width: 2.5%3b stroke-dasharray: 1%2c 0%3b'/%3e%3c/marker%3e%3cg class='root'%3e%3cg class='clusters'%3e%3cg class='cluster' id='mermaid-0-Observability' data-look='classic'%3e%3crect style='' x='8' y='518' width='523.21875' height='257'/%3e%3cg class='cluster-label' transform='translate(223.3671875%2c 518)'%3e%3cforeignObject width='92.484375' height='24'%3e%3cdiv xmlns='http://www.w3.org/1999/xhtml' style='display: table-cell%3b white-space: nowrap%3b line-height: 1.5%3b'%3e%3cspan class='nodeLabel'%3e%3cp%3eObservability%3c/p%3e%3c/span%3e%3c/div%3e%3c/foreignObject%3e%3c/g%3e%3c/g%3e%3cg class='cluster' id='mermaid-0-DataTier' data-look='classic'%3e%3crect style='' x='551.21875' y='518' width='692.44921875' height='128'/%3e%3cg class='cluster-label' transform='translate(864.982421875%2c 518)'%3e%3cforeignObject width='64.921875' height='24'%3e%3cdiv xmlns='http://www.w3.org/1999/xhtml' style='display: table-cell%3b white-space: nowrap%3b line-height: 1.5%3b'%3e%3cspan class='nodeLabel'%3e%3cp%3eData Tier%3c/p%3e%3c/span%3e%3c/div%3e%3c/foreignObject%3e%3c/g%3e%3c/g%3e%3cg class='cluster' id='mermaid-0-Application' data-look='classic'%3e%3crect style='' x='8' y='316' width='1229.21484375' height='128'/%3e%3cg class='cluster-label' transform='translate(567.912109375%2c 316)'%3e%3cforeignObject width='109.390625' height='24'%3e%3cdiv xmlns='http://www.w3.org/1999/xhtml' style='display: table-cell%3b white-space: nowrap%3b line-height: 1.5%3b'%3e%3cspan class='nodeLabel'%3e%3cp%3eApplication Tier%3c/p%3e%3c/span%3e%3c/div%3e%3c/foreignObject%3e%3c/g%3e%3c/g%3e%3cg class='cluster' id='mermaid-0-LoadBalancer' data-look='classic'%3e%3crect style='' x='595.328125' y='162' width='379.1796875' height='104'/%3e%3cg class='cluster-label' transform='translate(733.32421875%2c 162)'%3e%3cforeignObject width='103.1875' height='24'%3e%3cdiv xmlns='http://www.w3.org/1999/xhtml' style='display: table-cell%3b white-space: nowrap%3b line-height: 1.5%3b'%3e%3cspan class='nodeLabel'%3e%3cp%3eLoad Balancer%3c/p%3e%3c/span%3e%3c/div%3e%3c/foreignObject%3e%3c/g%3e%3c/g%3e%3cg class='cluster' id='mermaid-0-Internet' data-look='classic'%3e%3crect style='' x='546.73046875' y='8' width='471.84375' height='104'/%3e%3cg class='cluster-label' transform='translate(755.51953125%2c 8)'%3e%3cforeignObject width='54.265625' height='24'%3e%3cdiv xmlns='http://www.w3.org/1999/xhtml' style='display: table-cell%3b white-space: nowrap%3b line-height: 1.5%3b'%3e%3cspan class='nodeLabel'%3e%3cp%3eInternet%3c/p%3e%3c/span%3e%3c/div%3e%3c/foreignObject%3e%3c/g%3e%3c/g%3e%3c/g%3e%3cg class='edgePaths'%3e%3cpath d='M902.879%2c87L902.879%2c91.167C902.879%2c95.333%2c902.879%2c103.667%2c902.879%2c112C902.879%2c120.333%2c902.879%2c128.667%2c902.879%2c137C902.879%2c145.333%2c902.879%2c153.667%2c894.433%2c161.721C885.987%2c169.776%2c869.096%2c177.552%2c860.65%2c181.439L852.204%2c185.327' id='mermaid-0-L_Client_LB_0' class='edge-thickness-normal edge-pattern-solid edge-thickness-normal edge-pattern-solid flowchart-link' style='%3b' data-edge='true' data-et='edge' data-id='L_Client_LB_0' data-points='W3sieCI6OTAyLjg3ODkwNjI1LCJ5Ijo4N30seyJ4Ijo5MDIuODc4OTA2MjUsInkiOjExMn0seyJ4Ijo5MDIuODc4OTA2MjUsInkiOjEzN30seyJ4Ijo5MDIuODc4OTA2MjUsInkiOjE2Mn0seyJ4Ijo4NDguNTcwNzYzMjIxMTUzOCwieSI6MTg3fV0=' data-look='classic' marker-end='url(%23mermaid-0_flowchart-v2-pointEnd)'/%3e%3cpath d='M676.957%2c87L676.957%2c91.167C676.957%2c95.333%2c676.957%2c103.667%2c676.957%2c112C676.957%2c120.333%2c676.957%2c128.667%2c676.957%2c137C676.957%2c145.333%2c676.957%2c153.667%2c685.403%2c161.721C693.849%2c169.776%2c710.74%2c177.552%2c719.186%2c181.439L727.632%2c185.327' id='mermaid-0-L_Webhook_LB_0' class='edge-thickness-normal edge-pattern-solid edge-thickness-normal edge-pattern-solid flowchart-link' style='%3b' data-edge='true' data-et='edge' data-id='L_Webhook_LB_0' data-points='W3sieCI6Njc2Ljk1NzAzMTI1LCJ5Ijo4N30seyJ4Ijo2NzYuOTU3MDMxMjUsInkiOjExMn0seyJ4Ijo2NzYuOTU3MDMxMjUsInkiOjEzN30seyJ4Ijo2NzYuOTU3MDMxMjUsInkiOjE2Mn0seyJ4Ijo3MzEuMjY1MTc0Mjc4ODQ2MiwieSI6MTg3fV0=' data-look='classic' marker-end='url(%23mermaid-0_flowchart-v2-pointEnd)'/%3e%3cpath d='M842.024%2c241L850.065%2c245.167C858.106%2c249.333%2c874.188%2c257.667%2c882.229%2c266C890.27%2c274.333%2c890.27%2c282.667%2c890.27%2c291C890.27%2c299.333%2c890.27%2c307.667%2c890.27%2c315.333C890.27%2c323%2c890.27%2c330%2c890.27%2c333.5L890.27%2c337' id='mermaid-0-L_LB_API1_0' class='edge-thickness-normal edge-pattern-solid edge-thickness-normal edge-pattern-solid flowchart-link' style='%3b' data-edge='true' data-et='edge' data-id='L_LB_API1_0' data-points='W3sieCI6ODQyLjAyMzU4Nzc0MDM4NDYsInkiOjI0MX0seyJ4Ijo4OTAuMjY5NTMxMjUsInkiOjI2Nn0seyJ4Ijo4OTAuMjY5NTMxMjUsInkiOjI5MX0seyJ4Ijo4OTAuMjY5NTMxMjUsInkiOjMxNn0seyJ4Ijo4OTAuMjY5NTMxMjUsInkiOjM0MX1d' data-look='classic' marker-end='url(%23mermaid-0_flowchart-v2-pointEnd)'/%3e%3cpath d='M737.812%2c241L729.771%2c245.167C721.73%2c249.333%2c705.648%2c257.667%2c697.607%2c266C689.566%2c274.333%2c689.566%2c282.667%2c689.566%2c291C689.566%2c299.333%2c689.566%2c307.667%2c689.566%2c315.333C689.566%2c323%2c689.566%2c330%2c689.566%2c333.5L689.566%2c337' id='mermaid-0-L_LB_API2_0' class='edge-thickness-normal edge-pattern-solid edge-thickness-normal edge-pattern-solid flowchart-link' style='%3b' data-edge='true' data-et='edge' data-id='L_LB_API2_0' data-points='W3sieCI6NzM3LjgxMjM0OTc1OTYxNTQsInkiOjI0MX0seyJ4Ijo2ODkuNTY2NDA2MjUsInkiOjI2Nn0seyJ4Ijo2ODkuNTY2NDA2MjUsInkiOjI5MX0seyJ4Ijo2ODkuNTY2NDA2MjUsInkiOjMxNn0seyJ4Ijo2ODkuNTY2NDA2MjUsInkiOjM0MX1d' data-look='classic' marker-end='url(%23mermaid-0_flowchart-v2-pointEnd)'/%3e%3cpath d='M890.27%2c419L890.27%2c423.167C890.27%2c427.333%2c890.27%2c435.667%2c890.27%2c446C890.27%2c456.333%2c890.27%2c468.667%2c890.27%2c481C890.27%2c493.333%2c890.27%2c505.667%2c883.662%2c515.666C877.054%2c525.664%2c863.839%2c533.329%2c857.231%2c537.161L850.624%2c540.993' id='mermaid-0-L_API1_PG_0' class='edge-thickness-normal edge-pattern-solid edge-thickness-normal edge-pattern-solid flowchart-link' style='%3b' data-edge='true' data-et='edge' data-id='L_API1_PG_0' data-points='W3sieCI6ODkwLjI2OTUzMTI1LCJ5Ijo0MTl9LHsieCI6ODkwLjI2OTUzMTI1LCJ5Ijo0NDR9LHsieCI6ODkwLjI2OTUzMTI1LCJ5Ijo0ODF9LHsieCI6ODkwLjI2OTUzMTI1LCJ5Ijo1MTh9LHsieCI6ODQ3LjE2MzQ1MjE0ODQzNzUsInkiOjU0M31d' data-look='classic' marker-end='url(%23mermaid-0_flowchart-v2-pointEnd)'/%3e%3cpath d='M965.621%2c396.81L1000.878%2c404.675C1036.134%2c412.54%2c1106.647%2c428.27%2c1141.904%2c442.302C1177.16%2c456.333%2c1177.16%2c468.667%2c1177.16%2c481C1177.16%2c493.333%2c1177.16%2c505.667%2c1170.072%2c515.682C1162.984%2c525.697%2c1148.808%2c533.394%2c1141.72%2c537.243L1134.632%2c541.091' id='mermaid-0-L_API1_Redis_0' class='edge-thickness-normal edge-pattern-solid edge-thickness-normal edge-pattern-solid flowchart-link' style='%3b' data-edge='true' data-et='edge' data-id='L_API1_Redis_0' data-points='W3sieCI6OTY1LjYyMTA5Mzc1LCJ5IjozOTYuODA5NTQxOTYzOTQ1M30seyJ4IjoxMTc3LjE2MDE1NjI1LCJ5Ijo0NDR9LHsieCI6MTE3Ny4xNjAxNTYyNSwieSI6NDgxfSx7IngiOjExNzcuMTYwMTU2MjUsInkiOjUxOH0seyJ4IjoxMTMxLjExNjc2MDI1MzkwNjIsInkiOjU0M31d' data-look='classic' marker-end='url(%23mermaid-0_flowchart-v2-pointEnd)'/%3e%3cpath d='M689.566%2c419L689.566%2c423.167C689.566%2c427.333%2c689.566%2c435.667%2c689.566%2c446C689.566%2c456.333%2c689.566%2c468.667%2c689.566%2c481C689.566%2c493.333%2c689.566%2c505.667%2c694.905%2c515.615C700.243%2c525.563%2c710.919%2c533.125%2c716.258%2c536.907L721.596%2c540.688' id='mermaid-0-L_API2_PG_0' class='edge-thickness-normal edge-pattern-solid edge-thickness-normal edge-pattern-solid flowchart-link' style='%3b' data-edge='true' data-et='edge' data-id='L_API2_PG_0' data-points='W3sieCI6Njg5LjU2NjQwNjI1LCJ5Ijo0MTl9LHsieCI6Njg5LjU2NjQwNjI1LCJ5Ijo0NDR9LHsieCI6Njg5LjU2NjQwNjI1LCJ5Ijo0ODF9LHsieCI6Njg5LjU2NjQwNjI1LCJ5Ijo1MTh9LHsieCI6NzI0Ljg1OTk4NTM1MTU2MjUsInkiOjU0M31d' data-look='classic' marker-end='url(%23mermaid-0_flowchart-v2-pointEnd)'/%3e%3cpath d='M764.918%2c390.313L830.292%2c399.261C895.665%2c408.209%2c1026.413%2c426.104%2c1091.786%2c441.219C1157.16%2c456.333%2c1157.16%2c468.667%2c1157.16%2c481C1157.16%2c493.333%2c1157.16%2c505.667%2c1151.346%2c515.635C1145.532%2c525.604%2c1133.905%2c533.207%2c1128.091%2c537.009L1122.277%2c540.811' id='mermaid-0-L_API2_Redis_0' class='edge-thickness-normal edge-pattern-solid edge-thickness-normal edge-pattern-solid flowchart-link' style='%3b' data-edge='true' data-et='edge' data-id='L_API2_Redis_0' data-points='W3sieCI6NzY0LjkxNzk2ODc1LCJ5IjozOTAuMzEzNDM5ODE4MjE4M30seyJ4IjoxMTU3LjE2MDE1NjI1LCJ5Ijo0NDR9LHsieCI6MTE1Ny4xNjAxNTYyNSwieSI6NDgxfSx7IngiOjExNTcuMTYwMTU2MjUsInkiOjUxOH0seyJ4IjoxMTE4LjkyOTI2MDI1MzkwNjIsInkiOjU0M31d' data-look='classic' marker-end='url(%23mermaid-0_flowchart-v2-pointEnd)'/%3e%3cpath d='M965.621%2c402.353L989.02%2c409.294C1012.418%2c416.235%2c1059.215%2c430.118%2c1082.613%2c443.226C1106.012%2c456.333%2c1106.012%2c468.667%2c1106.012%2c481C1106.012%2c493.333%2c1106.012%2c505.667%2c1103.363%2c515.462C1100.714%2c525.256%2c1095.417%2c532.513%2c1092.768%2c536.141L1090.119%2c539.769' id='mermaid-0-L_API1_Redis_2' class='edge-thickness-normal edge-pattern-solid edge-thickness-normal edge-pattern-solid flowchart-link' style='%3b' data-edge='true' data-et='edge' data-id='L_API1_Redis_2' data-points='W3sieCI6OTY1LjYyMTA5Mzc1LCJ5Ijo0MDIuMzUzMDY4OTg0MjQ3Njd9LHsieCI6MTEwNi4wMTE3MTg3NSwieSI6NDQ0fSx7IngiOjExMDYuMDExNzE4NzUsInkiOjQ4MX0seyJ4IjoxMTA2LjAxMTcxODc1LCJ5Ijo1MTh9LHsieCI6MTA4Ny43NjA2ODExNTIzNDM4LCJ5Ijo1NDN9XQ==' data-look='classic' marker-end='url(%23mermaid-0_flowchart-v2-pointEnd)'/%3e%3cpath d='M764.918%2c394.432L808.051%2c402.694C851.184%2c410.955%2c937.449%2c427.477%2c980.582%2c441.905C1023.715%2c456.333%2c1023.715%2c468.667%2c1023.715%2c481C1023.715%2c493.333%2c1023.715%2c505.667%2c1025.707%2c515.417C1027.699%2c525.168%2c1031.683%2c532.336%2c1033.676%2c535.92L1035.668%2c539.504' id='mermaid-0-L_API2_Redis_2' class='edge-thickness-normal edge-pattern-solid edge-thickness-normal edge-pattern-solid flowchart-link' style='%3b' data-edge='true' data-et='edge' data-id='L_API2_Redis_2' data-points='W3sieCI6NzY0LjkxNzk2ODc1LCJ5IjozOTQuNDMyMjA4NzM5NTY2NTN9LHsieCI6MTAyMy43MTQ4NDM3NSwieSI6NDQ0fSx7IngiOjEwMjMuNzE0ODQzNzUsInkiOjQ4MX0seyJ4IjoxMDIzLjcxNDg0Mzc1LCJ5Ijo1MTh9LHsieCI6MTAzNy42MTEwMjI5NDkyMTg4LCJ5Ijo1NDN9XQ==' data-look='classic' marker-end='url(%23mermaid-0_flowchart-v2-pointEnd)'/%3e%3cpath d='M542.137%2c392.616L608.684%2c401.18C675.23%2c409.744%2c808.324%2c426.872%2c874.871%2c441.603C941.418%2c456.333%2c941.418%2c468.667%2c941.418%2c481C941.418%2c493.333%2c941.418%2c505.667%2c948.506%2c515.682C955.594%2c525.697%2c969.77%2c533.394%2c976.858%2c537.243L983.946%2c541.091' id='mermaid-0-L_Worker_Redis_0' class='edge-thickness-normal edge-pattern-solid edge-thickness-normal edge-pattern-solid flowchart-link' style='%3b' data-edge='true' data-et='edge' data-id='L_Worker_Redis_0' data-points='W3sieCI6NTQyLjEzNjcxODc1LCJ5IjozOTIuNjE1ODA5OTc4NjM1Mn0seyJ4Ijo5NDEuNDE3OTY4NzUsInkiOjQ0NH0seyJ4Ijo5NDEuNDE3OTY4NzUsInkiOjQ4MX0seyJ4Ijo5NDEuNDE3OTY4NzUsInkiOjUxOH0seyJ4Ijo5ODcuNDYxMzY0NzQ2MDkzOCwieSI6NTQzfV0=' data-look='classic' marker-end='url(%23mermaid-0_flowchart-v2-pointEnd)'/%3e%3cpath d='M542.137%2c413.584L556.934%2c418.653C571.732%2c423.723%2c601.327%2c433.861%2c616.124%2c445.097C630.922%2c456.333%2c630.922%2c468.667%2c630.922%2c481C630.922%2c493.333%2c630.922%2c505.667%2c641.074%2c516.194C651.227%2c526.722%2c671.532%2c535.444%2c681.684%2c539.804L691.836%2c544.165' id='mermaid-0-L_Worker_PG_0' class='edge-thickness-normal edge-pattern-solid edge-thickness-normal edge-pattern-solid flowchart-link' style='%3b' data-edge='true' data-et='edge' data-id='L_Worker_PG_0' data-points='W3sieCI6NTQyLjEzNjcxODc1LCJ5Ijo0MTMuNTgzNzc0MTc2Njg1ODR9LHsieCI6NjMwLjkyMTg3NSwieSI6NDQ0fSx7IngiOjYzMC45MjE4NzUsInkiOjQ4MX0seyJ4Ijo2MzAuOTIxODc1LCJ5Ijo1MTh9LHsieCI6Njk1LjUxMTcxODc1LCJ5Ijo1NDUuNzQ0MDE1OTQwMDE1Mn1d' data-look='classic' marker-end='url(%23mermaid-0_flowchart-v2-pointEnd)'/%3e%3cpath d='M814.918%2c391.673L758.624%2c400.395C702.329%2c409.116%2c589.741%2c426.558%2c533.447%2c441.446C477.152%2c456.333%2c477.152%2c468.667%2c477.152%2c481C477.152%2c493.333%2c477.152%2c505.667%2c472.373%2c517.491C467.594%2c529.315%2c458.035%2c540.63%2c453.256%2c546.287L448.477%2c551.944' id='mermaid-0-L_API1_Prom_0' class='edge-thickness-normal edge-pattern-solid edge-thickness-normal edge-pattern-solid flowchart-link' style='%3b' data-edge='true' data-et='edge' data-id='L_API1_Prom_0' data-points='W3sieCI6ODE0LjkxNzk2ODc1LCJ5IjozOTEuNjczNDQzMTQzNzgxMDd9LHsieCI6NDc3LjE1MjM0Mzc1LCJ5Ijo0NDR9LHsieCI6NDc3LjE1MjM0Mzc1LCJ5Ijo0ODF9LHsieCI6NDc3LjE1MjM0Mzc1LCJ5Ijo1MTh9LHsieCI6NDQ1Ljg5NTIwMjYzNjcxODc1LCJ5Ijo1NTV9XQ==' data-look='classic' marker-end='url(%23mermaid-0_flowchart-v2-pointEnd)'/%3e%3cpath d='M614.215%2c400.75L588.038%2c407.958C561.861%2c415.166%2c509.507%2c429.583%2c483.329%2c442.958C457.152%2c456.333%2c457.152%2c468.667%2c457.152%2c481C457.152%2c493.333%2c457.152%2c505.667%2c454.183%2c517.412C451.214%2c529.156%2c445.276%2c540.313%2c442.306%2c545.891L439.337%2c551.469' id='mermaid-0-L_API2_Prom_0' class='edge-thickness-normal edge-pattern-solid edge-thickness-normal edge-pattern-solid flowchart-link' style='%3b' data-edge='true' data-et='edge' data-id='L_API2_Prom_0' data-points='W3sieCI6NjE0LjIxNDg0Mzc1LCJ5Ijo0MDAuNzQ5NjA1MDI4NzQwNDZ9LHsieCI6NDU3LjE1MjM0Mzc1LCJ5Ijo0NDR9LHsieCI6NDU3LjE1MjM0Mzc1LCJ5Ijo0ODF9LHsieCI6NDU3LjE1MjM0Mzc1LCJ5Ijo1MTh9LHsieCI6NDM3LjQ1NzcwMjYzNjcxODc1LCJ5Ijo1NTV9XQ==' data-look='classic' marker-end='url(%23mermaid-0_flowchart-v2-pointEnd)'/%3e%3cpath d='M425.203%2c419L423.183%2c423.167C421.164%2c427.333%2c417.125%2c435.667%2c415.105%2c446C413.086%2c456.333%2c413.086%2c468.667%2c413.086%2c481C413.086%2c493.333%2c413.086%2c505.667%2c413.947%2c517.341C414.807%2c529.016%2c416.528%2c540.032%2c417.389%2c545.54L418.25%2c551.048' id='mermaid-0-L_Worker_Prom_0' class='edge-thickness-normal edge-pattern-solid edge-thickness-normal edge-pattern-solid flowchart-link' style='%3b' data-edge='true' data-et='edge' data-id='L_Worker_Prom_0' data-points='W3sieCI6NDI1LjIwMjk0MTg5NDUzMTI1LCJ5Ijo0MTl9LHsieCI6NDEzLjA4NTkzNzUsInkiOjQ0NH0seyJ4Ijo0MTMuMDg1OTM3NSwieSI6NDgxfSx7IngiOjQxMy4wODU5Mzc1LCJ5Ijo1MTh9LHsieCI6NDE4Ljg2NzE4NzUsInkiOjU1NX1d' data-look='classic' marker-end='url(%23mermaid-0_flowchart-v2-pointEnd)'/%3e%3cpath d='M423.086%2c609L423.086%2c615.167C423.086%2c621.333%2c423.086%2c633.667%2c423.086%2c644C423.086%2c654.333%2c423.086%2c662.667%2c414.973%2c670.712C406.86%2c678.758%2c390.635%2c686.516%2c382.522%2c690.395L374.409%2c694.275' id='mermaid-0-L_Prom_Grafana_0' class='edge-thickness-normal edge-pattern-solid edge-thickness-normal edge-pattern-solid flowchart-link' style='%3b' data-edge='true' data-et='edge' data-id='L_Prom_Grafana_0' data-points='W3sieCI6NDIzLjA4NTkzNzUsInkiOjYwOX0seyJ4Ijo0MjMuMDg1OTM3NSwieSI6NjQ2fSx7IngiOjQyMy4wODU5Mzc1LCJ5Ijo2NzF9LHsieCI6MzcwLjgwMDQwNTY0OTAzODQ1LCJ5Ijo2OTZ9XQ==' data-look='classic' marker-end='url(%23mermaid-0_flowchart-v2-pointEnd)'/%3e%3cpath d='M814.918%2c388.774L735.868%2c397.978C656.818%2c407.182%2c498.717%2c425.591%2c419.667%2c440.962C340.617%2c456.333%2c340.617%2c468.667%2c340.617%2c481C340.617%2c493.333%2c340.617%2c505.667%2c325.094%2c517.134C309.572%2c528.602%2c278.526%2c539.204%2c263.003%2c544.505L247.481%2c549.807' id='mermaid-0-L_API1_Loki_0' class='edge-thickness-normal edge-pattern-solid edge-thickness-normal edge-pattern-solid flowchart-link' style='%3b' data-edge='true' data-et='edge' data-id='L_API1_Loki_0' data-points='W3sieCI6ODE0LjkxNzk2ODc1LCJ5IjozODguNzczNzI3NzExNDA4NDd9LHsieCI6MzQwLjYxNzE4NzUsInkiOjQ0NH0seyJ4IjozNDAuNjE3MTg3NSwieSI6NDgxfSx7IngiOjM0MC42MTcxODc1LCJ5Ijo1MTh9LHsieCI6MjQzLjY5NTMxMjUsInkiOjU1MS4wOTkyMTYyNzQ4MDQxfV0=' data-look='classic' marker-end='url(%23mermaid-0_flowchart-v2-pointEnd)'/%3e%3cpath d='M614.215%2c390.176L547.792%2c399.147C481.37%2c408.118%2c348.525%2c426.059%2c282.102%2c441.196C215.68%2c456.333%2c215.68%2c468.667%2c215.68%2c481C215.68%2c493.333%2c215.68%2c505.667%2c212.078%2c515.523C208.477%2c525.379%2c201.274%2c532.758%2c197.673%2c536.448L194.072%2c540.138' id='mermaid-0-L_API2_Loki_0' class='edge-thickness-normal edge-pattern-solid edge-thickness-normal edge-pattern-solid flowchart-link' style='%3b' data-edge='true' data-et='edge' data-id='L_API2_Loki_0' data-points='W3sieCI6NjE0LjIxNDg0Mzc1LCJ5IjozOTAuMTc2NDgyNzEwMjk5NjR9LHsieCI6MjE1LjY3OTY4NzUsInkiOjQ0NH0seyJ4IjoyMTUuNjc5Njg3NSwieSI6NDgxfSx7IngiOjIxNS42Nzk2ODc1LCJ5Ijo1MTh9LHsieCI6MTkxLjI3NzgzMjAzMTI1LCJ5Ijo1NDN9XQ==' data-look='classic' marker-end='url(%23mermaid-0_flowchart-v2-pointEnd)'/%3e%3cpath d='M346.074%2c397.755L303.519%2c405.463C260.964%2c413.17%2c175.853%2c428.585%2c133.298%2c442.459C90.742%2c456.333%2c90.742%2c468.667%2c90.742%2c481C90.742%2c493.333%2c90.742%2c505.667%2c94.344%2c515.523C97.945%2c525.379%2c105.147%2c532.758%2c108.749%2c536.448L112.35%2c540.138' id='mermaid-0-L_Worker_Loki_0' class='edge-thickness-normal edge-pattern-solid edge-thickness-normal edge-pattern-solid flowchart-link' style='%3b' data-edge='true' data-et='edge' data-id='L_Worker_Loki_0' data-points='W3sieCI6MzQ2LjA3NDIxODc1LCJ5IjozOTcuNzU1MDk4ODgyMzkxM30seyJ4Ijo5MC43NDIxODc1LCJ5Ijo0NDR9LHsieCI6OTAuNzQyMTg3NSwieSI6NDgxfSx7IngiOjkwLjc0MjE4NzUsInkiOjUxOH0seyJ4IjoxMTUuMTQ0MDQyOTY4NzUsInkiOjU0M31d' data-look='classic' marker-end='url(%23mermaid-0_flowchart-v2-pointEnd)'/%3e%3cpath d='M153.211%2c621L153.211%2c625.167C153.211%2c629.333%2c153.211%2c637.667%2c153.211%2c646C153.211%2c654.333%2c153.211%2c662.667%2c169.612%2c672.127C186.014%2c681.587%2c218.816%2c692.173%2c235.218%2c697.467L251.619%2c702.76' id='mermaid-0-L_Loki_Grafana_0' class='edge-thickness-normal edge-pattern-solid edge-thickness-normal edge-pattern-solid flowchart-link' style='%3b' data-edge='true' data-et='edge' data-id='L_Loki_Grafana_0' data-points='W3sieCI6MTUzLjIxMDkzNzUsInkiOjYyMX0seyJ4IjoxNTMuMjEwOTM3NSwieSI6NjQ2fSx7IngiOjE1My4yMTA5Mzc1LCJ5Ijo2NzF9LHsieCI6MjU1LjQyNTc4MTI1LCJ5Ijo3MDMuOTg4Njc3OTY0NDU4fV0=' data-look='classic' marker-end='url(%23mermaid-0_flowchart-v2-pointEnd)'/%3e%3c/g%3e%3cg class='edgeLabels'%3e%3cg class='edgeLabel'%3e%3cg class='label' data-id='L_Client_LB_0' transform='translate(0%2c 0)'%3e%3cforeignObject width='0' height='0'%3e%3cdiv xmlns='http://www.w3.org/1999/xhtml' class='labelBkg' style='display: table-cell%3b white-space: nowrap%3b line-height: 1.5%3b max-width: 200px%3b text-align: center%3b'%3e%3cspan class='edgeLabel'%3e%3c/span%3e%3c/div%3e%3c/foreignObject%3e%3c/g%3e%3c/g%3e%3cg class='edgeLabel'%3e%3cg class='label' data-id='L_Webhook_LB_0' transform='translate(0%2c 0)'%3e%3cforeignObject width='0' height='0'%3e%3cdiv xmlns='http://www.w3.org/1999/xhtml' class='labelBkg' style='display: table-cell%3b white-space: nowrap%3b line-height: 1.5%3b max-width: 200px%3b text-align: center%3b'%3e%3cspan class='edgeLabel'%3e%3c/span%3e%3c/div%3e%3c/foreignObject%3e%3c/g%3e%3c/g%3e%3cg class='edgeLabel'%3e%3cg class='label' data-id='L_LB_API1_0' transform='translate(0%2c 0)'%3e%3cforeignObject width='0' height='0'%3e%3cdiv xmlns='http://www.w3.org/1999/xhtml' class='labelBkg' style='display: table-cell%3b white-space: nowrap%3b line-height: 1.5%3b max-width: 200px%3b text-align: center%3b'%3e%3cspan class='edgeLabel'%3e%3c/span%3e%3c/div%3e%3c/foreignObject%3e%3c/g%3e%3c/g%3e%3cg class='edgeLabel'%3e%3cg class='label' data-id='L_LB_API2_0' transform='translate(0%2c 0)'%3e%3cforeignObject width='0' height='0'%3e%3cdiv xmlns='http://www.w3.org/1999/xhtml' class='labelBkg' style='display: table-cell%3b white-space: nowrap%3b line-height: 1.5%3b max-width: 200px%3b text-align: center%3b'%3e%3cspan class='edgeLabel'%3e%3c/span%3e%3c/div%3e%3c/foreignObject%3e%3c/g%3e%3c/g%3e%3cg class='edgeLabel'%3e%3cg class='label' data-id='L_API1_PG_0' transform='translate(0%2c 0)'%3e%3cforeignObject width='0' height='0'%3e%3cdiv xmlns='http://www.w3.org/1999/xhtml' class='labelBkg' style='display: table-cell%3b white-space: nowrap%3b line-height: 1.5%3b max-width: 200px%3b text-align: center%3b'%3e%3cspan class='edgeLabel'%3e%3c/span%3e%3c/div%3e%3c/foreignObject%3e%3c/g%3e%3c/g%3e%3cg class='edgeLabel'%3e%3cg class='label' data-id='L_API1_Redis_0' transform='translate(0%2c 0)'%3e%3cforeignObject width='0' height='0'%3e%3cdiv xmlns='http://www.w3.org/1999/xhtml' class='labelBkg' style='display: table-cell%3b white-space: nowrap%3b line-height: 1.5%3b max-width: 200px%3b text-align: center%3b'%3e%3cspan class='edgeLabel'%3e%3c/span%3e%3c/div%3e%3c/foreignObject%3e%3c/g%3e%3c/g%3e%3cg class='edgeLabel'%3e%3cg class='label' data-id='L_API2_PG_0' transform='translate(0%2c 0)'%3e%3cforeignObject width='0' height='0'%3e%3cdiv xmlns='http://www.w3.org/1999/xhtml' class='labelBkg' style='display: table-cell%3b white-space: nowrap%3b line-height: 1.5%3b max-width: 200px%3b text-align: center%3b'%3e%3cspan class='edgeLabel'%3e%3c/span%3e%3c/div%3e%3c/foreignObject%3e%3c/g%3e%3c/g%3e%3cg class='edgeLabel'%3e%3cg class='label' data-id='L_API2_Redis_0' transform='translate(0%2c 0)'%3e%3cforeignObject width='0' height='0'%3e%3cdiv xmlns='http://www.w3.org/1999/xhtml' class='labelBkg' style='display: table-cell%3b white-space: nowrap%3b line-height: 1.5%3b max-width: 200px%3b text-align: center%3b'%3e%3cspan class='edgeLabel'%3e%3c/span%3e%3c/div%3e%3c/foreignObject%3e%3c/g%3e%3c/g%3e%3cg class='edgeLabel' transform='translate(1106.01171875%2c 481)'%3e%3cg class='label' data-id='L_API1_Redis_2' transform='translate(-31.1484375%2c -12)'%3e%3cforeignObject width='62.296875' height='24'%3e%3cdiv xmlns='http://www.w3.org/1999/xhtml' class='labelBkg' style='display: table-cell%3b white-space: nowrap%3b line-height: 1.5%3b max-width: 200px%3b text-align: center%3b'%3e%3cspan class='edgeLabel'%3e%3cp%3eenqueue%3c/p%3e%3c/span%3e%3c/div%3e%3c/foreignObject%3e%3c/g%3e%3c/g%3e%3cg class='edgeLabel' transform='translate(1023.71484375%2c 481)'%3e%3cg class='label' data-id='L_API2_Redis_2' transform='translate(-31.1484375%2c -12)'%3e%3cforeignObject width='62.296875' height='24'%3e%3cdiv xmlns='http://www.w3.org/1999/xhtml' class='labelBkg' style='display: table-cell%3b white-space: nowrap%3b line-height: 1.5%3b max-width: 200px%3b text-align: center%3b'%3e%3cspan class='edgeLabel'%3e%3cp%3eenqueue%3c/p%3e%3c/span%3e%3c/div%3e%3c/foreignObject%3e%3c/g%3e%3c/g%3e%3cg class='edgeLabel' transform='translate(941.41796875%2c 481)'%3e%3cg class='label' data-id='L_Worker_Redis_0' transform='translate(-31.1484375%2c -12)'%3e%3cforeignObject width='62.296875' height='24'%3e%3cdiv xmlns='http://www.w3.org/1999/xhtml' class='labelBkg' style='display: table-cell%3b white-space: nowrap%3b line-height: 1.5%3b max-width: 200px%3b text-align: center%3b'%3e%3cspan class='edgeLabel'%3e%3cp%3edequeue%3c/p%3e%3c/span%3e%3c/div%3e%3c/foreignObject%3e%3c/g%3e%3c/g%3e%3cg class='edgeLabel'%3e%3cg class='label' data-id='L_Worker_PG_0' transform='translate(0%2c 0)'%3e%3cforeignObject width='0' height='0'%3e%3cdiv xmlns='http://www.w3.org/1999/xhtml' class='labelBkg' style='display: table-cell%3b white-space: nowrap%3b line-height: 1.5%3b max-width: 200px%3b text-align: center%3b'%3e%3cspan class='edgeLabel'%3e%3c/span%3e%3c/div%3e%3c/foreignObject%3e%3c/g%3e%3c/g%3e%3cg class='edgeLabel'%3e%3cg class='label' data-id='L_API1_Prom_0' transform='translate(0%2c 0)'%3e%3cforeignObject width='0' height='0'%3e%3cdiv xmlns='http://www.w3.org/1999/xhtml' class='labelBkg' style='display: table-cell%3b white-space: nowrap%3b line-height: 1.5%3b max-width: 200px%3b text-align: center%3b'%3e%3cspan class='edgeLabel'%3e%3c/span%3e%3c/div%3e%3c/foreignObject%3e%3c/g%3e%3c/g%3e%3cg class='edgeLabel'%3e%3cg class='label' data-id='L_API2_Prom_0' transform='translate(0%2c 0)'%3e%3cforeignObject width='0' height='0'%3e%3cdiv xmlns='http://www.w3.org/1999/xhtml' class='labelBkg' style='display: table-cell%3b white-space: nowrap%3b line-height: 1.5%3b max-width: 200px%3b text-align: center%3b'%3e%3cspan class='edgeLabel'%3e%3c/span%3e%3c/div%3e%3c/foreignObject%3e%3c/g%3e%3c/g%3e%3cg class='edgeLabel'%3e%3cg class='label' data-id='L_Worker_Prom_0' transform='translate(0%2c 0)'%3e%3cforeignObject width='0' height='0'%3e%3cdiv xmlns='http://www.w3.org/1999/xhtml' class='labelBkg' style='display: table-cell%3b white-space: nowrap%3b line-height: 1.5%3b max-width: 200px%3b text-align: center%3b'%3e%3cspan class='edgeLabel'%3e%3c/span%3e%3c/div%3e%3c/foreignObject%3e%3c/g%3e%3c/g%3e%3cg class='edgeLabel'%3e%3cg class='label' data-id='L_Prom_Grafana_0' transform='translate(0%2c 0)'%3e%3cforeignObject width='0' height='0'%3e%3cdiv xmlns='http://www.w3.org/1999/xhtml' class='labelBkg' style='display: table-cell%3b white-space: nowrap%3b line-height: 1.5%3b max-width: 200px%3b text-align: center%3b'%3e%3cspan class='edgeLabel'%3e%3c/span%3e%3c/div%3e%3c/foreignObject%3e%3c/g%3e%3c/g%3e%3cg class='edgeLabel' transform='translate(340.6171875%2c 481)'%3e%3cg class='label' data-id='L_API1_Loki_0' transform='translate(-52.46875%2c -12)'%3e%3cforeignObject width='104.9375' height='24'%3e%3cdiv xmlns='http://www.w3.org/1999/xhtml' class='labelBkg' style='display: table-cell%3b white-space: nowrap%3b line-height: 1.5%3b max-width: 200px%3b text-align: center%3b'%3e%3cspan class='edgeLabel'%3e%3cp%3estructured logs%3c/p%3e%3c/span%3e%3c/div%3e%3c/foreignObject%3e%3c/g%3e%3c/g%3e%3cg class='edgeLabel' transform='translate(215.6796875%2c 481)'%3e%3cg class='label' data-id='L_API2_Loki_0' transform='translate(-52.46875%2c -12)'%3e%3cforeignObject width='104.9375' height='24'%3e%3cdiv xmlns='http://www.w3.org/1999/xhtml' class='labelBkg' style='display: table-cell%3b white-space: nowrap%3b line-height: 1.5%3b max-width: 200px%3b text-align: center%3b'%3e%3cspan class='edgeLabel'%3e%3cp%3estructured logs%3c/p%3e%3c/span%3e%3c/div%3e%3c/foreignObject%3e%3c/g%3e%3c/g%3e%3cg class='edgeLabel' transform='translate(90.7421875%2c 481)'%3e%3cg class='label' data-id='L_Worker_Loki_0' transform='translate(-52.46875%2c -12)'%3e%3cforeignObject width='104.9375' height='24'%3e%3cdiv xmlns='http://www.w3.org/1999/xhtml' class='labelBkg' style='display: table-cell%3b white-space: nowrap%3b line-height: 1.5%3b max-width: 200px%3b text-align: center%3b'%3e%3cspan class='edgeLabel'%3e%3cp%3estructured logs%3c/p%3e%3c/span%3e%3c/div%3e%3c/foreignObject%3e%3c/g%3e%3c/g%3e%3cg class='edgeLabel'%3e%3cg class='label' data-id='L_Loki_Grafana_0' transform='translate(0%2c 0)'%3e%3cforeignObject width='0' height='0'%3e%3cdiv xmlns='http://www.w3.org/1999/xhtml' class='labelBkg' style='display: table-cell%3b white-space: nowrap%3b line-height: 1.5%3b max-width: 200px%3b text-align: center%3b'%3e%3cspan class='edgeLabel'%3e%3c/span%3e%3c/div%3e%3c/foreignObject%3e%3c/g%3e%3c/g%3e%3c/g%3e%3cg class='nodes'%3e%3cg class='node default' id='mermaid-0-flowchart-Client-0' data-look='classic' transform='translate(902.87890625%2c 60)'%3e%3crect class='basic label-container' style='' x='-80.6953125' y='-27' width='161.390625' height='54'/%3e%3cg class='label' style='' transform='translate(-50.6953125%2c -12)'%3e%3crect/%3e%3cforeignObject width='101.390625' height='24'%3e%3cdiv xmlns='http://www.w3.org/1999/xhtml' style='display: table-cell%3b white-space: nowrap%3b line-height: 1.5%3b max-width: 200px%3b text-align: center%3b'%3e%3cspan class='nodeLabel'%3e%3cp%3eTenant Clients%3c/p%3e%3c/span%3e%3c/div%3e%3c/foreignObject%3e%3c/g%3e%3c/g%3e%3cg class='node default' id='mermaid-0-flowchart-Webhook-1' data-look='classic' transform='translate(676.95703125%2c 60)'%3e%3crect class='basic label-container' style='' x='-95.2265625' y='-27' width='190.453125' height='54'/%3e%3cg class='label' style='' transform='translate(-65.2265625%2c -12)'%3e%3crect/%3e%3cforeignObject width='130.453125' height='24'%3e%3cdiv xmlns='http://www.w3.org/1999/xhtml' style='display: table-cell%3b white-space: nowrap%3b line-height: 1.5%3b max-width: 200px%3b text-align: center%3b'%3e%3cspan class='nodeLabel'%3e%3cp%3eWebhook Sources%3c/p%3e%3c/span%3e%3c/div%3e%3c/foreignObject%3e%3c/g%3e%3c/g%3e%3cg class='node default' id='mermaid-0-flowchart-LB-2' data-look='classic' transform='translate(789.91796875%2c 214)'%3e%3crect class='basic label-container' style='' x='-88.2578125' y='-27' width='176.515625' height='54'/%3e%3cg class='label' style='' transform='translate(-58.2578125%2c -12)'%3e%3crect/%3e%3cforeignObject width='116.515625' height='24'%3e%3cdiv xmlns='http://www.w3.org/1999/xhtml' style='display: table-cell%3b white-space: nowrap%3b line-height: 1.5%3b max-width: 200px%3b text-align: center%3b'%3e%3cspan class='nodeLabel'%3e%3cp%3eALB / Cloudflare%3c/p%3e%3c/span%3e%3c/div%3e%3c/foreignObject%3e%3c/g%3e%3c/g%3e%3cg class='node default' id='mermaid-0-flowchart-API1-3' data-look='classic' transform='translate(890.26953125%2c 380)'%3e%3crect class='basic label-container' style='' x='-75.3515625' y='-39' width='150.703125' height='78'/%3e%3cg class='label' style='' transform='translate(-45.3515625%2c -24)'%3e%3crect/%3e%3cforeignObject width='90.703125' height='48'%3e%3cdiv xmlns='http://www.w3.org/1999/xhtml' style='display: table-cell%3b white-space: nowrap%3b line-height: 1.5%3b max-width: 200px%3b text-align: center%3b'%3e%3cspan class='nodeLabel'%3e%3cp%3eAPI Server 1%3cbr /%3e(uvicorn)%3c/p%3e%3c/span%3e%3c/div%3e%3c/foreignObject%3e%3c/g%3e%3c/g%3e%3cg class='node default' id='mermaid-0-flowchart-API2-4' data-look='classic' transform='translate(689.56640625%2c 380)'%3e%3crect class='basic label-container' style='' x='-75.3515625' y='-39' width='150.703125' height='78'/%3e%3cg class='label' style='' transform='translate(-45.3515625%2c -24)'%3e%3crect/%3e%3cforeignObject width='90.703125' height='48'%3e%3cdiv xmlns='http://www.w3.org/1999/xhtml' style='display: table-cell%3b white-space: nowrap%3b line-height: 1.5%3b max-width: 200px%3b text-align: center%3b'%3e%3cspan class='nodeLabel'%3e%3cp%3eAPI Server 2%3cbr /%3e(uvicorn)%3c/p%3e%3c/span%3e%3c/div%3e%3c/foreignObject%3e%3c/g%3e%3c/g%3e%3cg class='node default' id='mermaid-0-flowchart-Worker-5' data-look='classic' transform='translate(444.10546875%2c 380)'%3e%3crect class='basic label-container' style='' x='-98.03125' y='-39' width='196.0625' height='78'/%3e%3cg class='label' style='' transform='translate(-68.03125%2c -24)'%3e%3crect/%3e%3cforeignObject width='136.0625' height='48'%3e%3cdiv xmlns='http://www.w3.org/1999/xhtml' style='display: table-cell%3b white-space: nowrap%3b line-height: 1.5%3b max-width: 200px%3b text-align: center%3b'%3e%3cspan class='nodeLabel'%3e%3cp%3eARQ Worker%3cbr /%3e(background tasks)%3c/p%3e%3c/span%3e%3c/div%3e%3c/foreignObject%3e%3c/g%3e%3c/g%3e%3cg class='node default' id='mermaid-0-flowchart-PG-6' data-look='classic' transform='translate(779.91796875%2c 582)'%3e%3crect class='basic label-container' style='fill:%23e3f2fd !important%3bstroke:%231565c0 !important' x='-84.40625' y='-39' width='168.8125' height='78'/%3e%3cg class='label' style='' transform='translate(-54.40625%2c -24)'%3e%3crect/%3e%3cforeignObject width='108.8125' height='48'%3e%3cdiv xmlns='http://www.w3.org/1999/xhtml' style='display: table-cell%3b white-space: nowrap%3b line-height: 1.5%3b max-width: 200px%3b text-align: center%3b'%3e%3cspan class='nodeLabel'%3e%3cp%3ePostgreSQL 16%3cbr /%3e(RDS)%3c/p%3e%3c/span%3e%3c/div%3e%3c/foreignObject%3e%3c/g%3e%3c/g%3e%3cg class='node default' id='mermaid-0-flowchart-Redis-7' data-look='classic' transform='translate(1059.2890625%2c 582)'%3e%3crect class='basic label-container' style='fill:%23ffebee !important%3bstroke:%23c62828 !important' x='-78.015625' y='-39' width='156.03125' height='78'/%3e%3cg class='label' style='' transform='translate(-48.015625%2c -24)'%3e%3crect/%3e%3cforeignObject width='96.03125' height='48'%3e%3cdiv xmlns='http://www.w3.org/1999/xhtml' style='display: table-cell%3b white-space: nowrap%3b line-height: 1.5%3b max-width: 200px%3b text-align: center%3b'%3e%3cspan class='nodeLabel'%3e%3cp%3eRedis 7%3cbr /%3e(ElastiCache)%3c/p%3e%3c/span%3e%3c/div%3e%3c/foreignObject%3e%3c/g%3e%3c/g%3e%3cg class='node default' id='mermaid-0-flowchart-Prom-8' data-look='classic' transform='translate(423.0859375%2c 582)'%3e%3crect class='basic label-container' style='' x='-73.1328125' y='-27' width='146.265625' height='54'/%3e%3cg class='label' style='' transform='translate(-43.1328125%2c -12)'%3e%3crect/%3e%3cforeignObject width='86.265625' height='24'%3e%3cdiv xmlns='http://www.w3.org/1999/xhtml' style='display: table-cell%3b white-space: nowrap%3b line-height: 1.5%3b max-width: 200px%3b text-align: center%3b'%3e%3cspan class='nodeLabel'%3e%3cp%3ePrometheus%3c/p%3e%3c/span%3e%3c/div%3e%3c/foreignObject%3e%3c/g%3e%3c/g%3e%3cg class='node default' id='mermaid-0-flowchart-Grafana-9' data-look='classic' transform='translate(314.33203125%2c 723)'%3e%3crect class='basic label-container' style='fill:%23e8f5e9 !important%3bstroke:%232e7d32 !important' x='-58.90625' y='-27' width='117.8125' height='54'/%3e%3cg class='label' style='' transform='translate(-28.90625%2c -12)'%3e%3crect/%3e%3cforeignObject width='57.8125' height='24'%3e%3cdiv xmlns='http://www.w3.org/1999/xhtml' style='display: table-cell%3b white-space: nowrap%3b line-height: 1.5%3b max-width: 200px%3b text-align: center%3b'%3e%3cspan class='nodeLabel'%3e%3cp%3eGrafana%3c/p%3e%3c/span%3e%3c/div%3e%3c/foreignObject%3e%3c/g%3e%3c/g%3e%3cg class='node default' id='mermaid-0-flowchart-Loki-10' data-look='classic' transform='translate(153.2109375%2c 582)'%3e%3crect class='basic label-container' style='' x='-90.484375' y='-39' width='180.96875' height='78'/%3e%3cg class='label' style='' transform='translate(-60.484375%2c -24)'%3e%3crect/%3e%3cforeignObject width='120.96875' height='48'%3e%3cdiv xmlns='http://www.w3.org/1999/xhtml' style='display: table-cell%3b white-space: nowrap%3b line-height: 1.5%3b max-width: 200px%3b text-align: center%3b'%3e%3cspan class='nodeLabel'%3e%3cp%3eLoki%3cbr /%3e(log aggregation)%3c/p%3e%3c/span%3e%3c/div%3e%3c/foreignObject%3e%3c/g%3e%3c/g%3e%3c/g%3e%3c/g%3e%3c/g%3e%3cdefs%3e%3cfilter id='mermaid-0-drop-shadow' height='130%25' width='130%25'%3e%3cfeDropShadow dx='4' dy='4' stdDeviation='0' flood-opacity='0.06' flood-color='black'/%3e%3c/filter%3e%3c/defs%3e%3cdefs%3e%3cfilter id='mermaid-0-drop-shadow-small' height='150%25' width='150%25'%3e%3cfeDropShadow dx='2' dy='2' stdDeviation='0' flood-opacity='0.06' flood-color='black'/%3e%3c/filter%3e%3c/defs%3e%3clinearGradient id='mermaid-0-gradient' gradientUnits='objectBoundingBox' x1='0%25' y1='0%25' x2='100%25' y2='0%25'%3e%3cstop offset='0%25' stop-color='hsl(0%2c 0%25%2c 83.3333333333%25)' stop-opacity='1'/%3e%3cstop offset='100%25' stop-color='hsl(0%2c 0%25%2c 88.9215686275%25)' stop-opacity='1'/%3e%3c/linearGradient%3e%3c/svg%3e)
Complete Project Structure
Every module, every config file. This is what 22 posts of incremental architecture produces:
shelfwise/├── src/│ ├── api/│ │ ├── v1/ # Part 21: version translation│ │ │ ├── __init__.py│ │ │ ├── catalog.py│ │ │ ├── orders.py│ │ │ └── schemas/│ │ │ ├── catalog.py│ │ │ └── orders.py│ │ ├── v2/│ │ │ ├── __init__.py│ │ │ ├── catalog.py│ │ │ ├── orders.py│ │ │ └── schemas/│ │ │ ├── catalog.py│ │ │ └── orders.py│ │ ├── deps.py # Part 5: dependency injection│ │ ├── router.py # Part 21: version mounting│ │ └── middleware/│ │ ├── tenant.py # Part 9: tenant extraction│ │ ├── rate_limit.py # Part 15: per-tenant rate limiting│ │ ├── query_count.py # Part 22: N+1 detection│ │ ├── deprecation.py # Part 21: deprecation headers│ │ └── request_id.py # Part 12: correlation IDs│ ├── core/│ │ ├── config.py # Part 10: tenant-aware config│ │ ├── context.py # Part 9: contextvars tenant propagation│ │ ├── tenant.py # Part 9: tenant dataclass│ │ ├── security.py # Part 18: auth and encryption│ │ └── serialization.py # Part 22: orjson response class│ ├── db/│ │ ├── base.py # Part 3: declarative base + TenantMixin│ │ ├── session.py # Part 11: connection pooling│ │ ├── query_counter.py # Part 22: query event listener│ │ └── events.py # Part 9: tenant session events│ ├── models/│ │ ├── book.py # Part 3: SQLAlchemy models│ │ ├── author.py│ │ ├── order.py│ │ ├── tenant.py # Part 9: tenant model│ │ └── audit_log.py # Part 18: audit trail│ ├── repositories/│ │ ├── base.py # Part 3: generic repository protocol│ │ ├── book_repository.py│ │ ├── order_repository.py│ │ └── tenant_repository.py│ ├── services/│ │ ├── book_service.py # Part 4: service layer│ │ ├── order_service.py│ │ ├── tenant_service.py # Part 9: tenant lifecycle│ │ └── notification_service.py # Part 20: event-driven notifications│ ├── schemas/│ │ ├── book.py # Part 2: Pydantic schemas with protocols│ │ ├── order.py│ │ └── tenant.py│ ├── errors/│ │ ├── base.py # Part 6: error hierarchy│ │ ├── handlers.py # Part 6: FastAPI exception handlers│ │ └── codes.py # Part 6: error code registry│ ├── tasks/│ │ ├── worker.py # Part 14: ARQ worker setup│ │ ├── email_tasks.py # Part 14: async email│ │ ├── webhook_tasks.py # Part 14: webhook delivery + retry│ │ └── cleanup_tasks.py # Part 14: tenant data cleanup│ ├── cache/│ │ ├── manager.py # Part 13: cache manager│ │ └── invalidation.py # Part 13: tenant-scoped invalidation│ ├── events/│ │ ├── bus.py # Part 20: event bus│ │ ├── handlers.py # Part 20: event handlers│ │ └── schemas.py # Part 20: event schemas│ ├── health/│ │ └── checks.py # Part 19: health check endpoints│ ├── observability/│ │ ├── logging.py # Part 12: structlog configuration│ │ ├── tracing.py # Part 12: OpenTelemetry setup│ │ └── metrics.py # Part 12: Prometheus metrics│ └── main.py # Application entrypoint├── alembic/│ ├── versions/ # Part 17: migration management│ │ ├── 001_initial.py│ │ ├── 002_add_tenant.py│ │ └── ...│ ├── env.py│ └── alembic.ini├── tests/│ ├── unit/ # Part 8: unit tests│ │ ├── test_book_service.py│ │ ├── test_order_service.py│ │ └── test_version_translation.py│ ├── integration/ # Part 8: integration tests│ │ ├── test_tenant_isolation.py│ │ └── test_order_flow.py│ ├── contract/ # Part 21: schemathesis contract tests│ │ └── test_api_contract.py│ ├── load/ # Part 22: locust load tests│ │ └── locustfile.py│ ├── performance/ # Part 22: p99 regression tests│ │ ├── baseline.json│ │ └── test_p99_regression.py│ └── conftest.py├── scripts/│ ├── provision_tenant.py # Tenant onboarding automation│ ├── offboard_tenant.py # Tenant offboarding│ └── seed_dev_data.py # Development data seeding├── runbooks/│ ├── db_slow.md # "DB is slow" runbook│ ├── bad_deploy.md # "Bad deploy" runbook│ ├── tenant_data_issue.md # "Tenant reports data issue" runbook│ └── tenant_deletion.md # "Tenant deletion" runbook├── docker-compose.yml├── Dockerfile├── pyproject.toml├── .github/│ └── workflows/│ ├── ci.yml # Full CI pipeline│ └── load-test.yml # Scheduled load tests└── .env.exampleDocker Compose: The Local Stack
Development should mirror production topology. Docker Compose gives every developer a full ShelfWise environment with one command.
services:  api:    build:      context: .      target: runtime    ports:      - "8000:8000"    environment:      - DATABASE_URL=postgresql+asyncpg://shelfwise:shelfwise@postgres:5432/shelfwise      - REDIS_URL=redis://redis:6379/0      - LOG_LEVEL=debug      - ENVIRONMENT=development    depends_on:      postgres:        condition: service_healthy      redis:        condition: service_healthy    volumes:      - ./src:/app/src  # Hot reload in development    command: uvicorn src.main:app --host 0.0.0.0 --port 8000 --reload
  worker:    build:      context: .      target: runtime    environment:      - DATABASE_URL=postgresql+asyncpg://shelfwise:shelfwise@postgres:5432/shelfwise      - REDIS_URL=redis://redis:6379/0      - LOG_LEVEL=debug    depends_on:      postgres:        condition: service_healthy      redis:        condition: service_healthy    command: arq src.tasks.worker.WorkerSettings
  postgres:    image: postgres:16-alpine    environment:      POSTGRES_USER: shelfwise      POSTGRES_PASSWORD: shelfwise      POSTGRES_DB: shelfwise    ports:      - "5432:5432"    volumes:      - pgdata:/var/lib/postgresql/data    healthcheck:      test: ["CMD-SHELL", "pg_isready -U shelfwise"]      interval: 5s      timeout: 3s      retries: 5
  redis:    image: redis:7-alpine    ports:      - "6379:6379"    healthcheck:      test: ["CMD", "redis-cli", "ping"]      interval: 5s      timeout: 3s      retries: 5
  mailhog:    image: mailhog/mailhog    ports:      - "1025:1025"  # SMTP      - "8025:8025"  # Web UI
volumes:  pgdata:
The Dockerfile: Multi-Stage, Minimal, Secure
Every layer of this Dockerfile serves a purpose. The build stage installs dependencies. The runtime stage copies only what is needed. The result is a small, secure image with no build tools, no dev dependencies, and no root access.
# Dockerfile# === Build stage: install dependencies ===FROM python:3.12-slim AS builder
RUN pip install --no-cache-dir uv
WORKDIR /appCOPY pyproject.toml uv.lock ./RUN uv sync --frozen --no-dev --no-editable
# === Runtime stage: minimal image ===FROM python:3.12-slim AS runtime
# Security: non-root userRUN groupadd --gid 1000 app && \    useradd --uid 1000 --gid 1000 --shell /bin/bash app
WORKDIR /app
# Copy only the virtual environment and source codeCOPY --from=builder /app/.venv /app/.venvCOPY src/ src/COPY alembic/ alembic/COPY alembic.ini .
# Use the virtual environmentENV PATH="/app/.venv/bin:$PATH"ENV PYTHONUNBUFFERED=1ENV PYTHONDONTWRITEBYTECODE=1
# Health check — Part 19 health endpointHEALTHCHECK --interval=30s --timeout=5s --retries=3 \    CMD python -c "import httpx; httpx.get('http://localhost:8000/health').raise_for_status()"
USER app
EXPOSE 8000CMD ["uvicorn", "src.main:app", "--host", "0.0.0.0", "--port", "8000", "--workers", "4"]The CI/CD Pipeline
The pipeline is the assembly line where every pattern from this series is verified in sequence. A failure at any stage stops the deployment.
%3b%7d%23mermaid-1 .cluster rect%7bfill:hsl(0%2c 0%25%2c 98.9215686275%25)%3bstroke:%23707070%3bstroke-width:1px%3b%7d%23mermaid-1 .cluster text%7bfill:%23333%3b%7d%23mermaid-1 .cluster span%7bcolor:%23333%3b%7d%23mermaid-1 div.mermaidTooltip%7bposition:absolute%3btext-align:center%3bmax-width:200px%3bpadding:2px%3bfont-family:arial%2csans-serif%3bfont-size:12px%3bbackground:hsl(-160%2c 0%25%2c 93.3333333333%25)%3bborder:1px solid %23707070%3bborder-radius:2px%3bpointer-events:none%3bz-index:100%3b%7d%23mermaid-1 .flowchartTitleText%7btext-anchor:middle%3bfont-size:18px%3bfill:black%3b%7d%23mermaid-1 rect.text%7bfill:none%3bstroke-width:0%3b%7d%23mermaid-1 .icon-shape%2c%23mermaid-1 .image-shape%7bbackground-color:white%3btext-align:center%3b%7d%23mermaid-1 .icon-shape p%2c%23mermaid-1 .image-shape p%7bbackground-color:white%3bpadding:2px%3b%7d%23mermaid-1 .icon-shape .label rect%2c%23mermaid-1 .image-shape .label rect%7bopacity:0.5%3bbackground-color:white%3bfill:white%3b%7d%23mermaid-1 .label-icon%7bdisplay:inline-block%3bheight:1em%3boverflow:visible%3bvertical-align:-0.125em%3b%7d%23mermaid-1 .node .label-icon path%7bfill:currentColor%3bstroke:revert%3bstroke-width:revert%3b%7d%23mermaid-1 .node .neo-node%7bstroke:%23999%3b%7d%23mermaid-1 %5bdata-look='neo'%5d.node rect%2c%23mermaid-1 %5bdata-look='neo'%5d.cluster rect%2c%23mermaid-1 %5bdata-look='neo'%5d.node polygon%7bstroke:url(%23mermaid-1-gradient)%3bfilter:drop-shadow( 1px 2px 2px rgba(185%2c185%2c185%2c1))%3b%7d%23mermaid-1 %5bdata-look='neo'%5d.node path%7bstroke:url(%23mermaid-1-gradient)%3bstroke-width:1px%3b%7d%23mermaid-1 %5bdata-look='neo'%5d.node .outer-path%7bfilter:drop-shadow( 1px 2px 2px rgba(185%2c185%2c185%2c1))%3b%7d%23mermaid-1 %5bdata-look='neo'%5d.node .neo-line path%7bstroke:%23999%3bfilter:none%3b%7d%23mermaid-1 %5bdata-look='neo'%5d.node circle%7bstroke:url(%23mermaid-1-gradient)%3bfilter:drop-shadow( 1px 2px 2px rgba(185%2c185%2c185%2c1))%3b%7d%23mermaid-1 %5bdata-look='neo'%5d.node circle .state-start%7bfill:black%3b%7d%23mermaid-1 %5bdata-look='neo'%5d.icon-shape .icon%7bfill:url(%23mermaid-1-gradient)%3bfilter:drop-shadow( 1px 2px 2px rgba(185%2c185%2c185%2c1))%3b%7d%23mermaid-1 %5bdata-look='neo'%5d.icon-shape .icon-neo path%7bstroke:url(%23mermaid-1-gradient)%3bfilter:drop-shadow( 1px 2px 2px rgba(185%2c185%2c185%2c1))%3b%7d%23mermaid-1 :root%7b--mermaid-font-family:arial%2csans-serif%3b%7d%3c/style%3e%3cg%3e%3cmarker id='mermaid-1_flowchart-v2-pointEnd' class='marker flowchart-v2' viewBox='0 0 10 10' refX='5' refY='5' markerUnits='userSpaceOnUse' markerWidth='8' markerHeight='8' orient='auto'%3e%3cpath d='M 0 0 L 10 5 L 0 10 z' class='arrowMarkerPath' style='stroke-width: 1%3b stroke-dasharray: 1%2c 0%3b'/%3e%3c/marker%3e%3cmarker id='mermaid-1_flowchart-v2-pointStart' class='marker flowchart-v2' viewBox='0 0 10 10' refX='4.5' refY='5' markerUnits='userSpaceOnUse' markerWidth='8' markerHeight='8' orient='auto'%3e%3cpath d='M 0 5 L 10 10 L 10 0 z' class='arrowMarkerPath' style='stroke-width: 1%3b stroke-dasharray: 1%2c 0%3b'/%3e%3c/marker%3e%3cmarker id='mermaid-1_flowchart-v2-pointEnd-margin' class='marker flowchart-v2' viewBox='0 0 11.5 14' refX='11.5' refY='7' markerUnits='userSpaceOnUse' markerWidth='10.5' markerHeight='14' orient='auto'%3e%3cpath d='M 0 0 L 11.5 7 L 0 14 z' class='arrowMarkerPath' style='stroke-width: 0%3b stroke-dasharray: 1%2c 0%3b'/%3e%3c/marker%3e%3cmarker id='mermaid-1_flowchart-v2-pointStart-margin' class='marker flowchart-v2' viewBox='0 0 11.5 14' refX='1' refY='7' markerUnits='userSpaceOnUse' markerWidth='11.5' markerHeight='14' orient='auto'%3e%3cpolygon points='0%2c7 11.5%2c14 11.5%2c0' class='arrowMarkerPath' style='stroke-width: 0%3b stroke-dasharray: 1%2c 0%3b'/%3e%3c/marker%3e%3cmarker id='mermaid-1_flowchart-v2-circleEnd' class='marker flowchart-v2' viewBox='0 0 10 10' refX='11' refY='5' markerUnits='userSpaceOnUse' markerWidth='11' markerHeight='11' orient='auto'%3e%3ccircle cx='5' cy='5' r='5' class='arrowMarkerPath' style='stroke-width: 1%3b stroke-dasharray: 1%2c 0%3b'/%3e%3c/marker%3e%3cmarker id='mermaid-1_flowchart-v2-circleStart' class='marker flowchart-v2' viewBox='0 0 10 10' refX='-1' refY='5' markerUnits='userSpaceOnUse' markerWidth='11' markerHeight='11' orient='auto'%3e%3ccircle cx='5' cy='5' r='5' class='arrowMarkerPath' style='stroke-width: 1%3b stroke-dasharray: 1%2c 0%3b'/%3e%3c/marker%3e%3cmarker id='mermaid-1_flowchart-v2-circleEnd-margin' class='marker flowchart-v2' viewBox='0 0 10 10' refY='5' refX='12.25' markerUnits='userSpaceOnUse' markerWidth='14' markerHeight='14' orient='auto'%3e%3ccircle cx='5' cy='5' r='5' class='arrowMarkerPath' style='stroke-width: 0%3b stroke-dasharray: 1%2c 0%3b'/%3e%3c/marker%3e%3cmarker id='mermaid-1_flowchart-v2-circleStart-margin' class='marker flowchart-v2' viewBox='0 0 10 10' refX='-2' refY='5' markerUnits='userSpaceOnUse' markerWidth='14' markerHeight='14' orient='auto'%3e%3ccircle cx='5' cy='5' r='5' class='arrowMarkerPath' style='stroke-width: 0%3b stroke-dasharray: 1%2c 0%3b'/%3e%3c/marker%3e%3cmarker id='mermaid-1_flowchart-v2-crossEnd' class='marker cross flowchart-v2' viewBox='0 0 11 11' refX='12' refY='5.2' markerUnits='userSpaceOnUse' markerWidth='11' markerHeight='11' orient='auto'%3e%3cpath d='M 1%2c1 l 9%2c9 M 10%2c1 l -9%2c9' class='arrowMarkerPath' style='stroke-width: 2%3b stroke-dasharray: 1%2c 0%3b'/%3e%3c/marker%3e%3cmarker id='mermaid-1_flowchart-v2-crossStart' class='marker cross flowchart-v2' viewBox='0 0 11 11' refX='-1' refY='5.2' markerUnits='userSpaceOnUse' markerWidth='11' markerHeight='11' orient='auto'%3e%3cpath d='M 1%2c1 l 9%2c9 M 10%2c1 l -9%2c9' class='arrowMarkerPath' style='stroke-width: 2%3b stroke-dasharray: 1%2c 0%3b'/%3e%3c/marker%3e%3cmarker id='mermaid-1_flowchart-v2-crossEnd-margin' class='marker cross flowchart-v2' viewBox='0 0 15 15' refX='17.7' refY='7.5' markerUnits='userSpaceOnUse' markerWidth='12' markerHeight='12' orient='auto'%3e%3cpath d='M 1%2c1 L 14%2c14 M 1%2c14 L 14%2c1' class='arrowMarkerPath' style='stroke-width: 2.5%3b'/%3e%3c/marker%3e%3cmarker id='mermaid-1_flowchart-v2-crossStart-margin' class='marker cross flowchart-v2' viewBox='0 0 15 15' refX='-3.5' refY='7.5' markerUnits='userSpaceOnUse' markerWidth='12' markerHeight='12' orient='auto'%3e%3cpath d='M 1%2c1 L 14%2c14 M 1%2c14 L 14%2c1' class='arrowMarkerPath' style='stroke-width: 2.5%3b stroke-dasharray: 1%2c 0%3b'/%3e%3c/marker%3e%3cg class='root'%3e%3cg class='clusters'/%3e%3cg class='edgePaths'%3e%3cpath d='M124.047%2c86.57L128.214%2c86.57C132.38%2c86.57%2c140.714%2c86.57%2c148.38%2c86.57C156.047%2c86.57%2c163.047%2c86.57%2c166.547%2c86.57L170.047%2c86.57' id='mermaid-1-L_Push_Lint_0' class='edge-thickness-normal edge-pattern-solid edge-thickness-normal edge-pattern-solid flowchart-link' style='%3b' data-edge='true' data-et='edge' data-id='L_Push_Lint_0' data-points='W3sieCI6MTI0LjA0Njg3NSwieSI6ODYuNTcwMzEyNX0seyJ4IjoxNDkuMDQ2ODc1LCJ5Ijo4Ni41NzAzMTI1fSx7IngiOjE3NC4wNDY4NzUsInkiOjg2LjU3MDMxMjV9XQ==' data-look='classic' marker-end='url(%23mermaid-1_flowchart-v2-pointEnd)'/%3e%3cpath d='M366.703%2c86.57L370.87%2c86.57C375.036%2c86.57%2c383.37%2c86.57%2c391.036%2c86.57C398.703%2c86.57%2c405.703%2c86.57%2c409.203%2c86.57L412.703%2c86.57' id='mermaid-1-L_Lint_Types_0' class='edge-thickness-normal edge-pattern-solid edge-thickness-normal edge-pattern-solid flowchart-link' style='%3b' data-edge='true' data-et='edge' data-id='L_Lint_Types_0' data-points='W3sieCI6MzY2LjcwMzEyNSwieSI6ODYuNTcwMzEyNX0seyJ4IjozOTEuNzAzMTI1LCJ5Ijo4Ni41NzAzMTI1fSx7IngiOjQxNi43MDMxMjUsInkiOjg2LjU3MDMxMjV9XQ==' data-look='classic' marker-end='url(%23mermaid-1_flowchart-v2-pointEnd)'/%3e%3cpath d='M573.609%2c86.57L577.776%2c86.57C581.943%2c86.57%2c590.276%2c86.57%2c597.943%2c86.57C605.609%2c86.57%2c612.609%2c86.57%2c616.109%2c86.57L619.609%2c86.57' id='mermaid-1-L_Types_Unit_0' class='edge-thickness-normal edge-pattern-solid edge-thickness-normal edge-pattern-solid flowchart-link' style='%3b' data-edge='true' data-et='edge' data-id='L_Types_Unit_0' data-points='W3sieCI6NTczLjYwOTM3NSwieSI6ODYuNTcwMzEyNX0seyJ4Ijo1OTguNjA5Mzc1LCJ5Ijo4Ni41NzAzMTI1fSx7IngiOjYyMy42MDkzNzUsInkiOjg2LjU3MDMxMjV9XQ==' data-look='classic' marker-end='url(%23mermaid-1_flowchart-v2-pointEnd)'/%3e%3cpath d='M760.984%2c86.57L765.151%2c86.57C769.318%2c86.57%2c777.651%2c86.57%2c785.318%2c86.57C792.984%2c86.57%2c799.984%2c86.57%2c803.484%2c86.57L806.984%2c86.57' id='mermaid-1-L_Unit_Integration_0' class='edge-thickness-normal edge-pattern-solid edge-thickness-normal edge-pattern-solid flowchart-link' style='%3b' data-edge='true' data-et='edge' data-id='L_Unit_Integration_0' data-points='W3sieCI6NzYwLjk4NDM3NSwieSI6ODYuNTcwMzEyNX0seyJ4Ijo3ODUuOTg0Mzc1LCJ5Ijo4Ni41NzAzMTI1fSx7IngiOjgxMC45ODQzNzUsInkiOjg2LjU3MDMxMjV9XQ==' data-look='classic' marker-end='url(%23mermaid-1_flowchart-v2-pointEnd)'/%3e%3cpath d='M997.281%2c86.57L1001.448%2c86.57C1005.615%2c86.57%2c1013.948%2c86.57%2c1021.615%2c86.57C1029.281%2c86.57%2c1036.281%2c86.57%2c1039.781%2c86.57L1043.281%2c86.57' id='mermaid-1-L_Integration_Contract_0' class='edge-thickness-normal edge-pattern-solid edge-thickness-normal edge-pattern-solid flowchart-link' style='%3b' data-edge='true' data-et='edge' data-id='L_Integration_Contract_0' data-points='W3sieCI6OTk3LjI4MTI1LCJ5Ijo4Ni41NzAzMTI1fSx7IngiOjEwMjIuMjgxMjUsInkiOjg2LjU3MDMxMjV9LHsieCI6MTA0Ny4yODEyNSwieSI6ODYuNTcwMzEyNX1d' data-look='classic' marker-end='url(%23mermaid-1_flowchart-v2-pointEnd)'/%3e%3cpath d='M1209.25%2c86.57L1213.417%2c86.57C1217.583%2c86.57%2c1225.917%2c86.57%2c1233.583%2c86.57C1241.25%2c86.57%2c1248.25%2c86.57%2c1251.75%2c86.57L1255.25%2c86.57' id='mermaid-1-L_Contract_Build_0' class='edge-thickness-normal edge-pattern-solid edge-thickness-normal edge-pattern-solid flowchart-link' style='%3b' data-edge='true' data-et='edge' data-id='L_Contract_Build_0' data-points='W3sieCI6MTIwOS4yNSwieSI6ODYuNTcwMzEyNX0seyJ4IjoxMjM0LjI1LCJ5Ijo4Ni41NzAzMTI1fSx7IngiOjEyNTkuMjUsInkiOjg2LjU3MDMxMjV9XQ==' data-look='classic' marker-end='url(%23mermaid-1_flowchart-v2-pointEnd)'/%3e%3cpath d='M1409.953%2c86.57L1414.12%2c86.57C1418.286%2c86.57%2c1426.62%2c86.57%2c1434.286%2c86.57C1441.953%2c86.57%2c1448.953%2c86.57%2c1452.453%2c86.57L1455.953%2c86.57' id='mermaid-1-L_Build_Staging_0' class='edge-thickness-normal edge-pattern-solid edge-thickness-normal edge-pattern-solid flowchart-link' style='%3b' data-edge='true' data-et='edge' data-id='L_Build_Staging_0' data-points='W3sieCI6MTQwOS45NTMxMjUsInkiOjg2LjU3MDMxMjV9LHsieCI6MTQzNC45NTMxMjUsInkiOjg2LjU3MDMxMjV9LHsieCI6MTQ1OS45NTMxMjUsInkiOjg2LjU3MDMxMjV9XQ==' data-look='classic' marker-end='url(%23mermaid-1_flowchart-v2-pointEnd)'/%3e%3cpath d='M1628.469%2c86.57L1632.635%2c86.57C1636.802%2c86.57%2c1645.135%2c86.57%2c1652.802%2c86.57C1660.469%2c86.57%2c1667.469%2c86.57%2c1670.969%2c86.57L1674.469%2c86.57' id='mermaid-1-L_Staging_Smoke_0' class='edge-thickness-normal edge-pattern-solid edge-thickness-normal edge-pattern-solid flowchart-link' style='%3b' data-edge='true' data-et='edge' data-id='L_Staging_Smoke_0' data-points='W3sieCI6MTYyOC40Njg3NSwieSI6ODYuNTcwMzEyNX0seyJ4IjoxNjUzLjQ2ODc1LCJ5Ijo4Ni41NzAzMTI1fSx7IngiOjE2NzguNDY4NzUsInkiOjg2LjU3MDMxMjV9XQ==' data-look='classic' marker-end='url(%23mermaid-1_flowchart-v2-pointEnd)'/%3e%3cpath d='M1829.766%2c86.57L1833.932%2c86.57C1838.099%2c86.57%2c1846.432%2c86.57%2c1854.099%2c86.57C1861.766%2c86.57%2c1868.766%2c86.57%2c1872.266%2c86.57L1875.766%2c86.57' id='mermaid-1-L_Smoke_LoadTest_0' class='edge-thickness-normal edge-pattern-solid edge-thickness-normal edge-pattern-solid flowchart-link' style='%3b' data-edge='true' data-et='edge' data-id='L_Smoke_LoadTest_0' data-points='W3sieCI6MTgyOS43NjU2MjUsInkiOjg2LjU3MDMxMjV9LHsieCI6MTg1NC43NjU2MjUsInkiOjg2LjU3MDMxMjV9LHsieCI6MTg3OS43NjU2MjUsInkiOjg2LjU3MDMxMjV9XQ==' data-look='classic' marker-end='url(%23mermaid-1_flowchart-v2-pointEnd)'/%3e%3cpath d='M2036.906%2c86.57L2041.073%2c86.57C2045.24%2c86.57%2c2053.573%2c86.57%2c2061.24%2c86.57C2068.906%2c86.57%2c2075.906%2c86.57%2c2079.406%2c86.57L2082.906%2c86.57' id='mermaid-1-L_LoadTest_Production_0' class='edge-thickness-normal edge-pattern-solid edge-thickness-normal edge-pattern-solid flowchart-link' style='%3b' data-edge='true' data-et='edge' data-id='L_LoadTest_Production_0' data-points='W3sieCI6MjAzNi45MDYyNSwieSI6ODYuNTcwMzEyNX0seyJ4IjoyMDYxLjkwNjI1LCJ5Ijo4Ni41NzAzMTI1fSx7IngiOjIwODYuOTA2MjUsInkiOjg2LjU3MDMxMjV9XQ==' data-look='classic' marker-end='url(%23mermaid-1_flowchart-v2-pointEnd)'/%3e%3cpath d='M2277.656%2c86.57L2281.823%2c86.57C2285.99%2c86.57%2c2294.323%2c86.57%2c2301.99%2c86.57C2309.656%2c86.57%2c2316.656%2c86.57%2c2320.156%2c86.57L2323.656%2c86.57' id='mermaid-1-L_Production_Monitor_0' class='edge-thickness-normal edge-pattern-solid edge-thickness-normal edge-pattern-solid flowchart-link' style='%3b' data-edge='true' data-et='edge' data-id='L_Production_Monitor_0' data-points='W3sieCI6MjI3Ny42NTYyNSwieSI6ODYuNTcwMzEyNX0seyJ4IjoyMzAyLjY1NjI1LCJ5Ijo4Ni41NzAzMTI1fSx7IngiOjIzMjcuNjU2MjUsInkiOjg2LjU3MDMxMjV9XQ==' data-look='classic' marker-end='url(%23mermaid-1_flowchart-v2-pointEnd)'/%3e%3c/g%3e%3cg class='edgeLabels'%3e%3cg class='edgeLabel'%3e%3cg class='label' data-id='L_Push_Lint_0' transform='translate(0%2c 0)'%3e%3cforeignObject width='0' height='0'%3e%3cdiv xmlns='http://www.w3.org/1999/xhtml' class='labelBkg' style='display: table-cell%3b white-space: nowrap%3b line-height: 1.5%3b max-width: 200px%3b text-align: center%3b'%3e%3cspan class='edgeLabel'%3e%3c/span%3e%3c/div%3e%3c/foreignObject%3e%3c/g%3e%3c/g%3e%3cg class='edgeLabel'%3e%3cg class='label' data-id='L_Lint_Types_0' transform='translate(0%2c 0)'%3e%3cforeignObject width='0' height='0'%3e%3cdiv xmlns='http://www.w3.org/1999/xhtml' class='labelBkg' style='display: table-cell%3b white-space: nowrap%3b line-height: 1.5%3b max-width: 200px%3b text-align: center%3b'%3e%3cspan class='edgeLabel'%3e%3c/span%3e%3c/div%3e%3c/foreignObject%3e%3c/g%3e%3c/g%3e%3cg class='edgeLabel'%3e%3cg class='label' data-id='L_Types_Unit_0' transform='translate(0%2c 0)'%3e%3cforeignObject width='0' height='0'%3e%3cdiv xmlns='http://www.w3.org/1999/xhtml' class='labelBkg' style='display: table-cell%3b white-space: nowrap%3b line-height: 1.5%3b max-width: 200px%3b text-align: center%3b'%3e%3cspan class='edgeLabel'%3e%3c/span%3e%3c/div%3e%3c/foreignObject%3e%3c/g%3e%3c/g%3e%3cg class='edgeLabel'%3e%3cg class='label' data-id='L_Unit_Integration_0' transform='translate(0%2c 0)'%3e%3cforeignObject width='0' height='0'%3e%3cdiv xmlns='http://www.w3.org/1999/xhtml' class='labelBkg' style='display: table-cell%3b white-space: nowrap%3b line-height: 1.5%3b max-width: 200px%3b text-align: center%3b'%3e%3cspan class='edgeLabel'%3e%3c/span%3e%3c/div%3e%3c/foreignObject%3e%3c/g%3e%3c/g%3e%3cg class='edgeLabel'%3e%3cg class='label' data-id='L_Integration_Contract_0' transform='translate(0%2c 0)'%3e%3cforeignObject width='0' height='0'%3e%3cdiv xmlns='http://www.w3.org/1999/xhtml' class='labelBkg' style='display: table-cell%3b white-space: nowrap%3b line-height: 1.5%3b max-width: 200px%3b text-align: center%3b'%3e%3cspan class='edgeLabel'%3e%3c/span%3e%3c/div%3e%3c/foreignObject%3e%3c/g%3e%3c/g%3e%3cg class='edgeLabel'%3e%3cg class='label' data-id='L_Contract_Build_0' transform='translate(0%2c 0)'%3e%3cforeignObject width='0' height='0'%3e%3cdiv xmlns='http://www.w3.org/1999/xhtml' class='labelBkg' style='display: table-cell%3b white-space: nowrap%3b line-height: 1.5%3b max-width: 200px%3b text-align: center%3b'%3e%3cspan class='edgeLabel'%3e%3c/span%3e%3c/div%3e%3c/foreignObject%3e%3c/g%3e%3c/g%3e%3cg class='edgeLabel'%3e%3cg class='label' data-id='L_Build_Staging_0' transform='translate(0%2c 0)'%3e%3cforeignObject width='0' height='0'%3e%3cdiv xmlns='http://www.w3.org/1999/xhtml' class='labelBkg' style='display: table-cell%3b white-space: nowrap%3b line-height: 1.5%3b max-width: 200px%3b text-align: center%3b'%3e%3cspan class='edgeLabel'%3e%3c/span%3e%3c/div%3e%3c/foreignObject%3e%3c/g%3e%3c/g%3e%3cg class='edgeLabel'%3e%3cg class='label' data-id='L_Staging_Smoke_0' transform='translate(0%2c 0)'%3e%3cforeignObject width='0' height='0'%3e%3cdiv xmlns='http://www.w3.org/1999/xhtml' class='labelBkg' style='display: table-cell%3b white-space: nowrap%3b line-height: 1.5%3b max-width: 200px%3b text-align: center%3b'%3e%3cspan class='edgeLabel'%3e%3c/span%3e%3c/div%3e%3c/foreignObject%3e%3c/g%3e%3c/g%3e%3cg class='edgeLabel'%3e%3cg class='label' data-id='L_Smoke_LoadTest_0' transform='translate(0%2c 0)'%3e%3cforeignObject width='0' height='0'%3e%3cdiv xmlns='http://www.w3.org/1999/xhtml' class='labelBkg' style='display: table-cell%3b white-space: nowrap%3b line-height: 1.5%3b max-width: 200px%3b text-align: center%3b'%3e%3cspan class='edgeLabel'%3e%3c/span%3e%3c/div%3e%3c/foreignObject%3e%3c/g%3e%3c/g%3e%3cg class='edgeLabel'%3e%3cg class='label' data-id='L_LoadTest_Production_0' transform='translate(0%2c 0)'%3e%3cforeignObject width='0' height='0'%3e%3cdiv xmlns='http://www.w3.org/1999/xhtml' class='labelBkg' style='display: table-cell%3b white-space: nowrap%3b line-height: 1.5%3b max-width: 200px%3b text-align: center%3b'%3e%3cspan class='edgeLabel'%3e%3c/span%3e%3c/div%3e%3c/foreignObject%3e%3c/g%3e%3c/g%3e%3cg class='edgeLabel'%3e%3cg class='label' data-id='L_Production_Monitor_0' transform='translate(0%2c 0)'%3e%3cforeignObject width='0' height='0'%3e%3cdiv xmlns='http://www.w3.org/1999/xhtml' class='labelBkg' style='display: table-cell%3b white-space: nowrap%3b line-height: 1.5%3b max-width: 200px%3b text-align: center%3b'%3e%3cspan class='edgeLabel'%3e%3c/span%3e%3c/div%3e%3c/foreignObject%3e%3c/g%3e%3c/g%3e%3c/g%3e%3cg class='nodes'%3e%3cg class='node default' id='mermaid-1-flowchart-Push-0' data-look='classic' transform='translate(66.0234375%2c 86.5703125)'%3e%3crect class='basic label-container' style='fill:%23e3f2fd !important%3bstroke:%231565c0 !important' x='-58.0234375' y='-27' width='116.046875' height='54'/%3e%3cg class='label' style='' transform='translate(-28.0234375%2c -12)'%3e%3crect/%3e%3cforeignObject width='56.046875' height='24'%3e%3cdiv xmlns='http://www.w3.org/1999/xhtml' style='display: table-cell%3b white-space: nowrap%3b line-height: 1.5%3b max-width: 200px%3b text-align: center%3b'%3e%3cspan class='nodeLabel'%3e%3cp%3egit push%3c/p%3e%3c/span%3e%3c/div%3e%3c/foreignObject%3e%3c/g%3e%3c/g%3e%3cg class='node default' id='mermaid-1-flowchart-Lint-1' data-look='classic' transform='translate(270.375%2c 86.5703125)'%3e%3crect class='basic label-container' style='' x='-96.328125' y='-39' width='192.65625' height='78'/%3e%3cg class='label' style='' transform='translate(-66.328125%2c -24)'%3e%3crect/%3e%3cforeignObject width='132.65625' height='48'%3e%3cdiv xmlns='http://www.w3.org/1999/xhtml' style='display: table-cell%3b white-space: nowrap%3b line-height: 1.5%3b max-width: 200px%3b text-align: center%3b'%3e%3cspan class='nodeLabel'%3e%3cp%3eLint%3cbr /%3eruff check %2b format%3c/p%3e%3c/span%3e%3c/div%3e%3c/foreignObject%3e%3c/g%3e%3c/g%3e%3cg class='node default' id='mermaid-1-flowchart-Types-3' data-look='classic' transform='translate(495.15625%2c 86.5703125)'%3e%3crect class='basic label-container' style='' x='-78.453125' y='-39' width='156.90625' height='78'/%3e%3cg class='label' style='' transform='translate(-48.453125%2c -24)'%3e%3crect/%3e%3cforeignObject width='96.90625' height='48'%3e%3cdiv xmlns='http://www.w3.org/1999/xhtml' style='display: table-cell%3b white-space: nowrap%3b line-height: 1.5%3b max-width: 200px%3b text-align: center%3b'%3e%3cspan class='nodeLabel'%3e%3cp%3eType Check%3cbr /%3epyright --strict%3c/p%3e%3c/span%3e%3c/div%3e%3c/foreignObject%3e%3c/g%3e%3c/g%3e%3cg class='node default' id='mermaid-1-flowchart-Unit-5' data-look='classic' transform='translate(692.296875%2c 86.5703125)'%3e%3crect class='basic label-container' style='' x='-68.6875' y='-39' width='137.375' height='78'/%3e%3cg class='label' style='' transform='translate(-38.6875%2c -24)'%3e%3crect/%3e%3cforeignObject width='77.375' height='48'%3e%3cdiv xmlns='http://www.w3.org/1999/xhtml' style='display: table-cell%3b white-space: nowrap%3b line-height: 1.5%3b max-width: 200px%3b text-align: center%3b'%3e%3cspan class='nodeLabel'%3e%3cp%3eUnit Tests%3cbr /%3epytest unit/%3c/p%3e%3c/span%3e%3c/div%3e%3c/foreignObject%3e%3c/g%3e%3c/g%3e%3cg class='node default' id='mermaid-1-flowchart-Integration-7' data-look='classic' transform='translate(904.1328125%2c 86.5703125)'%3e%3crect class='basic label-container' style='' x='-93.1484375' y='-51' width='186.296875' height='102'/%3e%3cg class='label' style='' transform='translate(-63.1484375%2c -36)'%3e%3crect/%3e%3cforeignObject width='126.296875' height='72'%3e%3cdiv xmlns='http://www.w3.org/1999/xhtml' style='display: table-cell%3b white-space: nowrap%3b line-height: 1.5%3b max-width: 200px%3b text-align: center%3b'%3e%3cspan class='nodeLabel'%3e%3cp%3eIntegration Tests%3cbr /%3epytest integration/%3cbr /%3e(tenant isolation)%3c/p%3e%3c/span%3e%3c/div%3e%3c/foreignObject%3e%3c/g%3e%3c/g%3e%3cg class='node default' id='mermaid-1-flowchart-Contract-9' data-look='classic' transform='translate(1128.265625%2c 86.5703125)'%3e%3crect class='basic label-container' style='' x='-80.984375' y='-39' width='161.96875' height='78'/%3e%3cg class='label' style='' transform='translate(-50.984375%2c -24)'%3e%3crect/%3e%3cforeignObject width='101.96875' height='48'%3e%3cdiv xmlns='http://www.w3.org/1999/xhtml' style='display: table-cell%3b white-space: nowrap%3b line-height: 1.5%3b max-width: 200px%3b text-align: center%3b'%3e%3cspan class='nodeLabel'%3e%3cp%3eContract Tests%3cbr /%3eschemathesis%3c/p%3e%3c/span%3e%3c/div%3e%3c/foreignObject%3e%3c/g%3e%3c/g%3e%3cg class='node default' id='mermaid-1-flowchart-Build-11' data-look='classic' transform='translate(1334.6015625%2c 86.5703125)'%3e%3crect class='basic label-container' style='' x='-75.3515625' y='-39' width='150.703125' height='78'/%3e%3cg class='label' style='' transform='translate(-45.3515625%2c -24)'%3e%3crect/%3e%3cforeignObject width='90.703125' height='48'%3e%3cdiv xmlns='http://www.w3.org/1999/xhtml' style='display: table-cell%3b white-space: nowrap%3b line-height: 1.5%3b max-width: 200px%3b text-align: center%3b'%3e%3cspan class='nodeLabel'%3e%3cp%3eDocker Build%3cbr /%3emulti-stage%3c/p%3e%3c/span%3e%3c/div%3e%3c/foreignObject%3e%3c/g%3e%3c/g%3e%3cg class='node default' id='mermaid-1-flowchart-Staging-13' data-look='classic' transform='translate(1544.2109375%2c 86.5703125)'%3e%3crect class='basic label-container' style='' x='-84.2578125' y='-27' width='168.515625' height='54'/%3e%3cg class='label' style='' transform='translate(-54.2578125%2c -12)'%3e%3crect/%3e%3cforeignObject width='108.515625' height='24'%3e%3cdiv xmlns='http://www.w3.org/1999/xhtml' style='display: table-cell%3b white-space: nowrap%3b line-height: 1.5%3b max-width: 200px%3b text-align: center%3b'%3e%3cspan class='nodeLabel'%3e%3cp%3eDeploy Staging%3c/p%3e%3c/span%3e%3c/div%3e%3c/foreignObject%3e%3c/g%3e%3c/g%3e%3cg class='node default' id='mermaid-1-flowchart-Smoke-15' data-look='classic' transform='translate(1754.1171875%2c 86.5703125)'%3e%3crect class='basic label-container' style='' x='-75.6484375' y='-39' width='151.296875' height='78'/%3e%3cg class='label' style='' transform='translate(-45.6484375%2c -24)'%3e%3crect/%3e%3cforeignObject width='91.296875' height='48'%3e%3cdiv xmlns='http://www.w3.org/1999/xhtml' style='display: table-cell%3b white-space: nowrap%3b line-height: 1.5%3b max-width: 200px%3b text-align: center%3b'%3e%3cspan class='nodeLabel'%3e%3cp%3eSmoke Tests%3cbr /%3ecritical paths%3c/p%3e%3c/span%3e%3c/div%3e%3c/foreignObject%3e%3c/g%3e%3c/g%3e%3cg class='node default' id='mermaid-1-flowchart-LoadTest-17' data-look='classic' transform='translate(1958.3359375%2c 86.5703125)'%3e%3cpolygon points='78.5703125%2c0 157.140625%2c-78.5703125 78.5703125%2c-157.140625 0%2c-78.5703125' class='label-container' transform='translate(-78.0703125%2c 78.5703125)' style='fill:%23fff3e0 !important%3bstroke:%23ef6c00 !important'/%3e%3cg class='label' style='' transform='translate(-39.5703125%2c -24)'%3e%3crect/%3e%3cforeignObject width='79.140625' height='48'%3e%3cdiv xmlns='http://www.w3.org/1999/xhtml' style='display: table-cell%3b white-space: nowrap%3b line-height: 1.5%3b max-width: 200px%3b text-align: center%3b'%3e%3cspan class='nodeLabel'%3e%3cp%3eLoad Test%3cbr /%3e(main only)%3c/p%3e%3c/span%3e%3c/div%3e%3c/foreignObject%3e%3c/g%3e%3c/g%3e%3cg class='node default' id='mermaid-1-flowchart-Production-19' data-look='classic' transform='translate(2182.28125%2c 86.5703125)'%3e%3crect class='basic label-container' style='fill:%23e8f5e9 !important%3bstroke:%232e7d32 !important' x='-95.375' y='-27' width='190.75' height='54'/%3e%3cg class='label' style='' transform='translate(-65.375%2c -12)'%3e%3crect/%3e%3cforeignObject width='130.75' height='24'%3e%3cdiv xmlns='http://www.w3.org/1999/xhtml' style='display: table-cell%3b white-space: nowrap%3b line-height: 1.5%3b max-width: 200px%3b text-align: center%3b'%3e%3cspan class='nodeLabel'%3e%3cp%3eDeploy Production%3c/p%3e%3c/span%3e%3c/div%3e%3c/foreignObject%3e%3c/g%3e%3c/g%3e%3cg class='node default' id='mermaid-1-flowchart-Monitor-21' data-look='classic' transform='translate(2423.0234375%2c 86.5703125)'%3e%3crect class='basic label-container' style='' x='-95.3671875' y='-39' width='190.734375' height='78'/%3e%3cg class='label' style='' transform='translate(-65.3671875%2c -24)'%3e%3crect/%3e%3cforeignObject width='130.734375' height='48'%3e%3cdiv xmlns='http://www.w3.org/1999/xhtml' style='display: table-cell%3b white-space: nowrap%3b line-height: 1.5%3b max-width: 200px%3b text-align: center%3b'%3e%3cspan class='nodeLabel'%3e%3cp%3eVerify Dashboards%3cbr /%3ep99%2c error rate%3c/p%3e%3c/span%3e%3c/div%3e%3c/foreignObject%3e%3c/g%3e%3c/g%3e%3c/g%3e%3c/g%3e%3c/g%3e%3cdefs%3e%3cfilter id='mermaid-1-drop-shadow' height='130%25' width='130%25'%3e%3cfeDropShadow dx='4' dy='4' stdDeviation='0' flood-opacity='0.06' flood-color='black'/%3e%3c/filter%3e%3c/defs%3e%3cdefs%3e%3cfilter id='mermaid-1-drop-shadow-small' height='150%25' width='150%25'%3e%3cfeDropShadow dx='2' dy='2' stdDeviation='0' flood-opacity='0.06' flood-color='black'/%3e%3c/filter%3e%3c/defs%3e%3clinearGradient id='mermaid-1-gradient' gradientUnits='objectBoundingBox' x1='0%25' y1='0%25' x2='100%25' y2='0%25'%3e%3cstop offset='0%25' stop-color='hsl(0%2c 0%25%2c 83.3333333333%25)' stop-opacity='1'/%3e%3cstop offset='100%25' stop-color='hsl(0%2c 0%25%2c 88.9215686275%25)' stop-opacity='1'/%3e%3c/linearGradient%3e%3c/svg%3e)
name: CI/CD Pipeline
on:  push:    branches: [main]  pull_request:    branches: [main]
jobs:  lint-and-type-check:    runs-on: ubuntu-latest    steps:      - uses: actions/checkout@v4      - uses: astral-sh/setup-uv@v3      - run: uv sync --frozen      - run: uv run ruff check .      - run: uv run ruff format --check .      - run: uv run pyright --strict
  unit-tests:    runs-on: ubuntu-latest    needs: lint-and-type-check    steps:      - uses: actions/checkout@v4      - uses: astral-sh/setup-uv@v3      - run: uv sync --frozen      - run: uv run pytest tests/unit/ --cov=src --cov-fail-under=80
  integration-tests:    runs-on: ubuntu-latest    needs: lint-and-type-check    services:      postgres:        image: postgres:16-alpine        env:          POSTGRES_USER: test          POSTGRES_PASSWORD: test          POSTGRES_DB: test        ports: ["5432:5432"]        options: >-          --health-cmd pg_isready          --health-interval 10s          --health-timeout 5s          --health-retries 5      redis:        image: redis:7-alpine        ports: ["6379:6379"]    steps:      - uses: actions/checkout@v4      - uses: astral-sh/setup-uv@v3      - run: uv sync --frozen      - run: uv run pytest tests/integration/ -x -v        env:          DATABASE_URL: postgresql+asyncpg://test:test@localhost:5432/test          REDIS_URL: redis://localhost:6379/0
  contract-tests:    runs-on: ubuntu-latest    needs: integration-tests    steps:      - uses: actions/checkout@v4      - uses: astral-sh/setup-uv@v3      - run: uv sync --frozen      - run: |          uv run uvicorn src.main:app --host 0.0.0.0 --port 8000 &          sleep 5          uv run schemathesis run http://localhost:8000/openapi.json --checks all
  deploy-staging:    if: github.ref == 'refs/heads/main'    runs-on: ubuntu-latest    needs: [unit-tests, integration-tests, contract-tests]    steps:      - uses: actions/checkout@v4      - run: docker build -t shelfwise:${{ github.sha }} .      - run: ./scripts/deploy.sh staging ${{ github.sha }}
  smoke-tests:    runs-on: ubuntu-latest    needs: deploy-staging    steps:      - uses: actions/checkout@v4      - run: ./scripts/smoke_test.sh https://staging.shelfwise.io
  deploy-production:    if: github.ref == 'refs/heads/main'    runs-on: ubuntu-latest    needs: smoke-tests    environment: production    steps:      - run: ./scripts/deploy.sh production ${{ github.sha }}
Environment Management
Staging must mirror production configuration with reduced resources. The differences should be minimal and explicit.
from pydantic import SecretStrfrom pydantic_settings import BaseSettings, SettingsConfigDict

class Settings(BaseSettings):    """Configuration from environment variables — Part 10."""    model_config = SettingsConfigDict(        env_file=".env",        env_file_encoding="utf-8",        case_sensitive=False,    )
    # Core    environment: str = "development"  # development | staging | production    debug: bool = False    log_level: str = "info"
    # Database — Part 11 connection pooling    database_url: SecretStr    db_pool_min: int = 5    db_pool_max: int = 20
    # Redis — Part 13 caching, Part 14 task queue    redis_url: str = "redis://localhost:6379/0"
    # Security — Part 18    jwt_secret: SecretStr = SecretStr("change-me-in-production")    encryption_key: SecretStr = SecretStr("change-me-in-production")
@property def is_production(self) -> bool: return self.environment == "production"| Setting | Staging | Production |
|---|---|---|
| DB pool size | 5-10 connections | 20-50 connections |
| API replicas | 1 | 2-4 (auto-scaled) |
| Worker replicas | 1 | 2-3 |
| Log level | debug | info |
| Rate limits | Relaxed (10x headroom) | Enforced per plan tier |
| Cache TTL | 60 seconds (catch stale issues) | 300 seconds |
| Health check interval | 30 seconds | 10 seconds |
| Alert routing | Slack #staging-alerts | PagerDuty on-call rotation |
Production Readiness Checklist
This is every pattern from every post, verified as a pre-launch gate. Do not ship without greens across the board.
| Category | Requirement | Part | Verification |
|---|---|---|---|
| Structure | Domain modules under 400 lines | 1 | wc -l on every .py file |
| Types | 100% public API type coverage | 2 | pyright --strict zero errors |
| Data | Repository pattern, no raw SQL in services | 3 | Code review |
| Logic | Service layer with no framework imports | 4 | grep for fastapi in services/ |
| DI | All dependencies injected, no global state | 5 | No module-level mutable state |
| Errors | Structured error hierarchy, no bare except | 6 | ruff rule BLE001 |
| Async | No blocking I/O in async functions | 7 | bandit check, code review |
| Tests | 80%+ coverage, isolation test passes | 8-9 | pytest --cov-fail-under=80 |
| Tenancy | Automatic tenant filtering on every query | 9 | Integration test with two tenants |
| Config | No secrets in code, env-based config | 10 | bandit, no .env in git |
| Pooling | Connection pool sized and monitored | 11 | Pool metrics in Grafana |
| Observability | Structured logs, traces, metrics | 12 | Dashboard exists, alerts configured |
| Cache | Tenant-scoped, invalidation tested | 13 | Cache hit rate metric |
| Tasks | Background tasks with retry and DLQ | 14 | Worker metrics in Grafana |
| Rate limits | Per-tenant, per-plan enforcement | 15 | Load test verifies limits |
| Consistency | Idempotency keys on mutations | 16 | Contract test with duplicate requests |
| Migrations | Reversible, zero-downtime | 17 | Alembic downgrade tested |
| Security | JWT auth, audit logging, encryption at rest | 18 | bandit -ll, pentest report |
| Health | Liveness + readiness + dependency checks | 19 | k8s/ECS probes configured |
| Events | Event bus for cross-domain side effects | 20 | Event handler tests pass |
| Versioning | Deprecated v1 with sunset headers | 21 | curl check for Deprecation header |
| Performance | p99 < 200ms, no N+1, load tested | 22 | Locust report, query counter < 10 |
Tenant Provisioning Automation
Onboarding a new tenant is a sequence of steps that must succeed atomically. If step 4 fails, steps 1-3 must be rolled back. Automate the entire flow.
"""Automated tenant provisioning pipeline."""import asynciofrom uuid import UUID
import structlog
from src.core.context import set_current_tenant, system_contextfrom src.db.session import get_sessionfrom src.models.tenant import TenantModelfrom src.services.tenant_service import TenantService
logger = structlog.get_logger()

async def provision_tenant(    slug: str,    name: str,    plan: str,    admin_email: str,) -> UUID:    """Provision a new tenant end-to-end.
    Steps:    1. Create tenant record in database    2. Run tenant-specific migrations (if schema-per-tenant)    3. Seed default data (categories, roles, permissions)    4. Warm caches for the new tenant    5. Send welcome email to admin    6. Notify operations channel
    Raises TenantProvisioningError on any failure.    """    async with system_context(reason="provisioning", operator="system"):        async with get_session() as session:            # Step 1: Create tenant record            tenant_service = TenantService(session)            tenant = await tenant_service.create_tenant(                slug=slug,                name=name,                plan=plan,            )            logger.info(                "tenant_created",                tenant_id=str(tenant.id),                slug=slug,            )
            # Step 2: Seed default data            await tenant_service.seed_defaults(tenant.id)            logger.info("tenant_defaults_seeded", tenant_id=str(tenant.id))
            # Step 3: Create admin user            await tenant_service.create_admin_user(                tenant_id=tenant.id,                email=admin_email,            )
            # Step 4: Warm caches            await tenant_service.warm_caches(tenant.id)
            # Step 5: Send welcome email (via background task)            await tenant_service.enqueue_welcome_email(                tenant_id=tenant.id,                admin_email=admin_email,            )
            await session.commit()            logger.info(                "tenant_provisioned",                tenant_id=str(tenant.id),                slug=slug,                plan=plan,            )            return tenant.id

if __name__ == "__main__":    import sys
    tenant_id = asyncio.run(        provision_tenant(            slug=sys.argv[1],            name=sys.argv[2],            plan=sys.argv[3],            admin_email=sys.argv[4],        )    )    print(f"Provisioned tenant: {tenant_id}")
Tenant Offboarding
Offboarding is the reverse, with an important addition: you must preserve audit logs for compliance and export tenant data before deletion.
"""Tenant offboarding pipeline: suspend → export → delete → archive."""import asynciofrom uuid import UUID
import structlog
logger = structlog.get_logger()

async def offboard_tenant(tenant_id: UUID, reason: str) -> None:    """Offboard a tenant with full data lifecycle.
    This is a multi-day process, not a single operation:    Day 0:  Suspend tenant (API returns 403, data preserved)    Day 1:  Export tenant data to S3 (GDPR data portability)    Day 30: Delete tenant data from database    Day 30: Archive audit logs to cold storage (7-year retention)    """    # Phase 1: Immediate suspension    await _suspend_tenant(tenant_id, reason)    logger.info("tenant_suspended", tenant_id=str(tenant_id), reason=reason)
    # Phase 2: Schedule data export (async task)    await _enqueue_data_export(tenant_id)    logger.info("tenant_export_scheduled", tenant_id=str(tenant_id))
    # Phase 3: Schedule deletion (30-day grace period)    await _schedule_deletion(tenant_id, grace_days=30)    logger.info(        "tenant_deletion_scheduled",        tenant_id=str(tenant_id),        grace_days=30,    )

async def _suspend_tenant(tenant_id: UUID, reason: str) -> None:    """Set tenant status to suspended. All API calls return 403."""    ...

async def _enqueue_data_export(tenant_id: UUID) -> None:    """Export all tenant data to S3 for data portability."""    ...

async def _schedule_deletion(tenant_id: UUID, grace_days: int) -> None:    """Schedule hard deletion after grace period."""    ...
Runbooks
Runbooks are not documentation — they are decision trees for 3am. Each one starts with a symptom, confirms the diagnosis, and prescribes specific commands.
Runbook: “Database Is Slow”
- Check connection pool saturation. Grafana panel:
db_pool_checked_out / db_pool_size. If above 80%, pool is the bottleneck. Increasedb_pool_maxand restart (Part 11). - Check for long-running queries.
SELECT pid, now() - pg_stat_activity.query_start AS duration, query FROM pg_stat_activity WHERE state = 'active' ORDER BY duration DESC LIMIT 10;Kill anything over 30 seconds:SELECT pg_terminate_backend(pid); - Check for lock contention.
SELECT blocked.pid, blocked.query, blocking.pid, blocking.query FROM pg_catalog.pg_locks blocked_locks JOIN pg_stat_activity blocked ON blocked.pid = blocked_locks.pid JOIN pg_catalog.pg_locks blocking_locks ON blocking_locks.locktype = blocked_locks.locktype WHERE NOT blocked_locks.granted; - Check for missing indexes.
SELECT schemaname, relname, seq_scan, idx_scan FROM pg_stat_user_tables WHERE seq_scan > idx_scan ORDER BY seq_scan - idx_scan DESC LIMIT 10;Tables with more sequential scans than index scans need composite indexes (Part 22).
Runbook: “Bad Deploy”
- Confirm the bad deploy. Check error rate spike in Grafana. If error rate > 5%, proceed to rollback.
- Rollback immediately.
./scripts/deploy.sh production <previous-sha>. Do not debug in production. Rollback first, investigate second. - Verify rollback. Error rate should return to baseline within 2 minutes. If not, the problem is not the deploy — check database, Redis, external dependencies.
- Post-rollback. Create an incident ticket. Identify the failing commit. Write a regression test that would have caught it. Deploy the fix through the full CI pipeline.
Runbook: “Tenant Reports Data Issue”
- Identify the tenant. Get
tenant_idfrom the support ticket or subdomain. - Pull recent traces. Filter Loki logs by
tenant_idand the reported timeframe (Part 12). Look for error logs, failed transactions, unexpected query results. - Check tenant isolation. Run the isolation integration test against production read-replica. If it fails, this is a SEV-1 — tenant data boundary has been breached. Escalate immediately.
- Check recent migrations. Did a migration run in the reported timeframe? Check Alembic history. Look for schema changes that could affect query results (Part 17).
- Reproduce with tenant data. Use the system context (Part 9) to query the tenant’s data in a staging environment. Never modify production data directly.
Incident Response
Severity Levels
| Level | Definition | Response Time | Example |
|---|---|---|---|
| SEV-1 | Data breach, total outage, data corruption | 15 minutes | Cross-tenant data leakage |
| SEV-2 | Major feature broken, one tenant fully impacted | 1 hour | Payment processing down for one tenant |
| SEV-3 | Degraded performance, partial impact | 4 hours | p99 above SLO, cache miss rate high |
| SEV-4 | Minor issue, workaround available | Next business day | Incorrect sort order on one endpoint |
Postmortem Template
Every SEV-1 and SEV-2 gets a postmortem within 48 hours. The postmortem is blameless — it focuses on system failures, not human failures.
## Incident: [Title]**Date:** YYYY-MM-DD**Duration:** X hours Y minutes**Severity:** SEV-N**Impact:** [Number of tenants affected, revenue impact, data impact]
## Timeline- HH:MM — Alert fired: [alert name]- HH:MM — On-call acknowledged- HH:MM — Root cause identified- HH:MM — Fix deployed- HH:MM — Monitoring confirmed recovery
## Root Cause[One paragraph: what broke and why]
## DetectionHow was this detected? Alert? Tenant report? Manual observation?Detection gap: [What should have caught this earlier?]
## ResolutionWhat was done to fix it? Rollback? Hotfix? Configuration change?
## Action Items| Action | Owner | Due Date | Status ||--------|-------|----------|--------|| [Specific, actionable item] | [Name] | [Date] | Open |
## Lessons Learned- What went well?- What went poorly?- Where did we get lucky?
First-Day Production: Monitoring Dashboard
Before a single tenant sends a request, your Grafana dashboard must have these panels:
Request metrics: Request rate by endpoint, error rate (4xx, 5xx) by endpoint, p50/p95/p99 latency by endpoint. These are Part 12 Prometheus metrics visualized.
Database metrics: Connection pool utilization, query duration p99, queries per request (Part 22 counter), active connections by tenant.
Tenant metrics: Request rate by tenant, error rate by tenant, cache hit rate by tenant (Part 13), rate limit rejections by tenant (Part 15).
Worker metrics: Queue depth, task success/failure rate, task duration p99, dead letter queue size (Part 14).
Alerting rules:
groups:  - name: shelfwise    rules:      - alert: HighErrorRate        expr: rate(http_requests_total{status=~"5.."}[5m]) / rate(http_requests_total[5m]) > 0.05        for: 2m        labels:          severity: sev2        annotations:          summary: "Error rate above 5% for 2 minutes"
      - alert: HighP99Latency        expr: histogram_quantile(0.99, rate(http_request_duration_seconds_bucket[5m])) > 0.5        for: 5m        labels:          severity: sev3        annotations:          summary: "p99 latency above 500ms for 5 minutes"
      - alert: QueryCountSpike        expr: avg(http_request_query_count) > 20        for: 1m        labels:          severity: sev3        annotations:          summary: "Average queries per request above 20 — probable N+1"
      - alert: PoolExhaustion        expr: db_pool_checked_out / db_pool_size > 0.9        for: 2m        labels:          severity: sev2        annotations:          summary: "DB connection pool above 90% — requests will queue"
      - alert: WorkerQueueBacklog        expr: arq_queue_length > 1000        for: 5m        labels:          severity: sev2        annotations:          summary: "Background task queue backlog above 1000"
The First Incident
ShelfWise launches with 10 beta tenants. Three weeks in, the WorkerQueueBacklog alert fires. The ARQ queue has 2,400 pending tasks and is growing.
Investigation timeline:
- T+0 min: Alert fires. On-call checks Grafana. Queue depth graph shows linear growth starting 2 hours ago.
- T+2 min: Filter tasks by type. 95% are
deliver_webhooktasks. All are retrying with exponential backoff. - T+5 min: Check webhook delivery logs. Tenant “Foyles” configured a webhook endpoint that is returning
500 Internal Server Error. Every failed delivery schedules a retry. 200 orders per hour, each triggering a webhook, each retrying 5 times. - T+8 min: Check the retry policy (Part 14). Max retries: 5. Backoff: exponential with jitter. But the webhook has been failing for 2 hours — the retries from early failures are still in the queue while new orders keep adding more.
- T+12 min: Apply the fix. Two actions in parallel:
- Pause webhook delivery for tenant “Foyles” by setting their webhook status to
suspendedin the tenant config (Part 10). - Drain the dead letter queue — all failed webhook tasks for Foyles are moved to DLQ for manual inspection.
- Pause webhook delivery for tenant “Foyles” by setting their webhook status to
- T+15 min: Queue depth stops growing. Within 10 minutes, it drains back to normal.
- T+20 min: Contact Foyles. Their webhook endpoint had a deployment that broke the handler. They fix it and confirm. Re-enable webhook delivery.
Postmortem action items:
- Add per-tenant queue depth metric. Alert when a single tenant has > 100 pending tasks.
- Add automatic webhook suspension after 10 consecutive failures for the same tenant.
- Add circuit breaker (Part 14) to the webhook delivery task — stop retrying after the circuit opens.
This is a small incident. Nobody lost data. No tenants were affected except Foyles, and their orders were processed normally — only the webhook notifications were delayed. But the incident exposed a gap in the system: the retry policy did not account for a persistently failing webhook endpoint generating unbounded queue growth.
Every gap you find in production adds a new item to the checklist. The checklist grows, and the system gets more robust. That is the process.
What This Series Built
Twenty-three posts. One application. Here is the arc:
Parts 1-8 established the foundation. Project structure (Part 1) gave us navigable modules. Protocols and type safety (Part 2) made contracts explicit. The repository pattern (Part 3) isolated data access. The service layer (Part 4) isolated business logic. Dependency injection (Part 5) made it all testable. Error handling (Part 6) made failures informative. Async patterns (Part 7) made it concurrent. Testing strategies (Part 8) proved it all worked.
Parts 9-20 evolved the application into a production multi-tenant SaaS. Tenant isolation (Part 9) made data leakage structurally impossible. Configuration (Part 10) made each tenant customizable. Connection pooling (Part 11) made it scalable. Observability (Part 12) made it debuggable. Caching (Part 13) made it fast. Background tasks (Part 14) made it resilient. Rate limiting (Part 15) made it fair. Data consistency (Part 16) made it correct. Migrations (Part 17) made it evolvable. Security (Part 18) made it trustworthy. Health checks (Part 19) made it operable. Event-driven architecture (Part 20) made it extensible.
Parts 21-23 brought it to production. API versioning (Part 21) made it evolvable without breaking tenants. Performance profiling and load testing (Part 22) proved it could handle real traffic. And this post assembled it all, deployed it, monitored it, and handled the first incident.
The architecture is not finished. It never is. But the patterns are in place, the monitoring is live, the runbooks are written, and the team knows how to respond when something breaks. That is the difference between a codebase and a production system.
Clean code is not about aesthetics. It is about building systems that you can understand at 3am when the pager goes off, that new team members can navigate on their first day, and that can evolve for years without a rewrite. Every pattern in this series exists because the alternative — the quick hack, the missing test, the skipped abstraction — has a cost that compounds until it becomes the only thing the team works on.
Write code for the engineer who will maintain it. That engineer is usually you, six months from now, having forgotten everything.